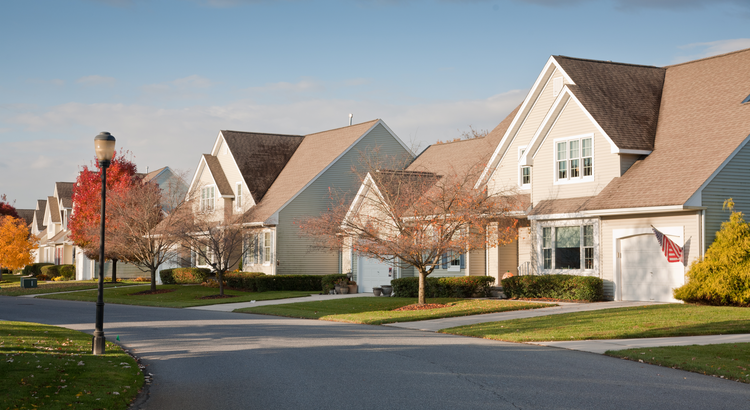
An important factor shaping today’s market is the number of homes for sale. And, if you’re considering whether or not to list your house, that’s one of the biggest advantages you have right now. When housing inventory is this low, your house will stand out, especially if it’s priced right.
But there are some early signs that more listings are coming. According to the latest data, new listings (homeowners who just put their house up for sale) are trending up. Here’s a look at why this is noteworthy and what it may mean for you.
More Homes Are Coming onto the Market than Usual
It’s well known that the busiest time in the housing market each year is the spring buying season. That’s why there’s a predictable increase in the volume of newly listed homes throughout the first half of the year. Sellers are anticipating this and ramping up for the months when buyers are most active. But, as the school year kicks off and as the holidays approach, the market cools. It’s what’s expected.
But here’s what’s surprising. Based on the latest data from Realtor.com, there’s an increase in the number of sellers listing their houses later this year than usual. A peak this late in the year isn’t typical. You can see both the normal seasonal trend and the unusual August in the graph below: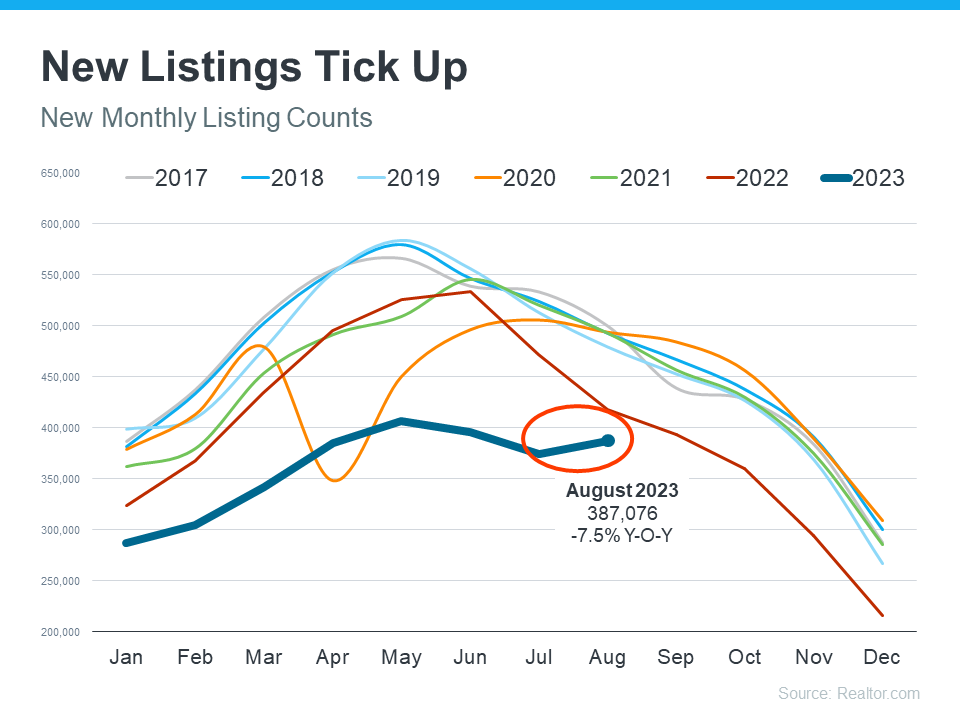 As Realtor.com explains:
“While inventory continues to be in short supply, August witnessed an unusual uptick in newly listed homes compared to July, hopefully signaling a return in seller activity heading toward the fall season . . .”
While this is only one month of data, it’s unusual enough to note. It’s still too early to say for sure if this trend will continue, but it’s something you’ll want to stay ahead of if it does.
What This Means for You
If you’ve been putting off selling your house, now may be the sweet spot to make your move. That’s because, if this trend continues, you’ll have more competition the longer you wait. And if your neighbor puts their house up for sale too, it means you may have to share buyers’ attention with that other homeowner. If you sell now, you can beat your neighbors to the punch.
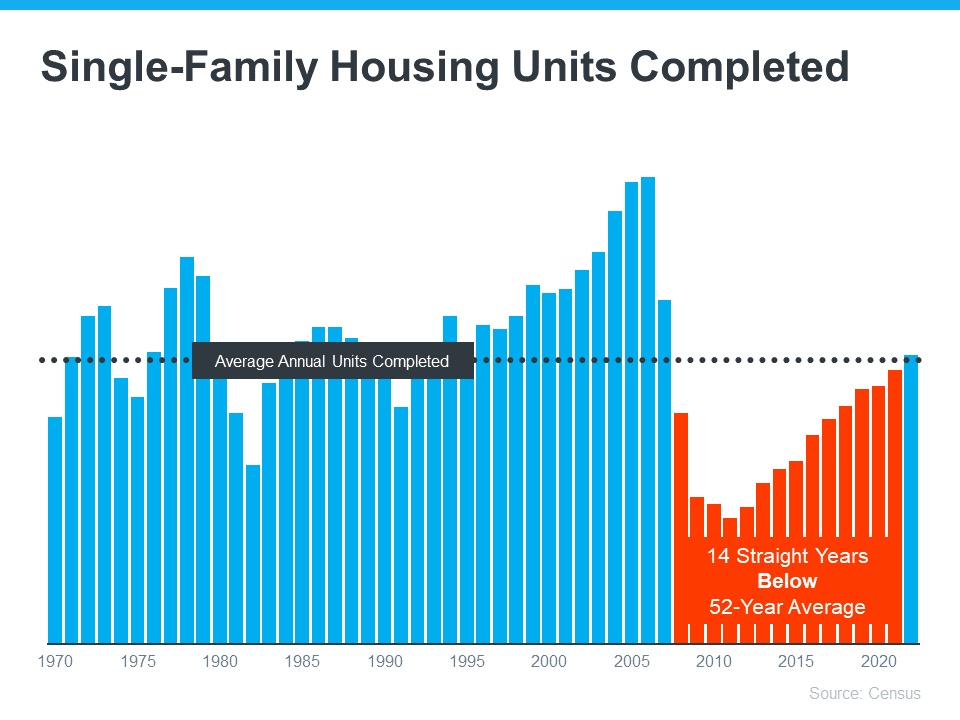
But, even with more homes coming onto the market, the market is still well below normal supply levels. And, that inventory deficit isn’t going to be reversed overnight. The graph below helps put this into context, so you can see the opportunity you still have now: 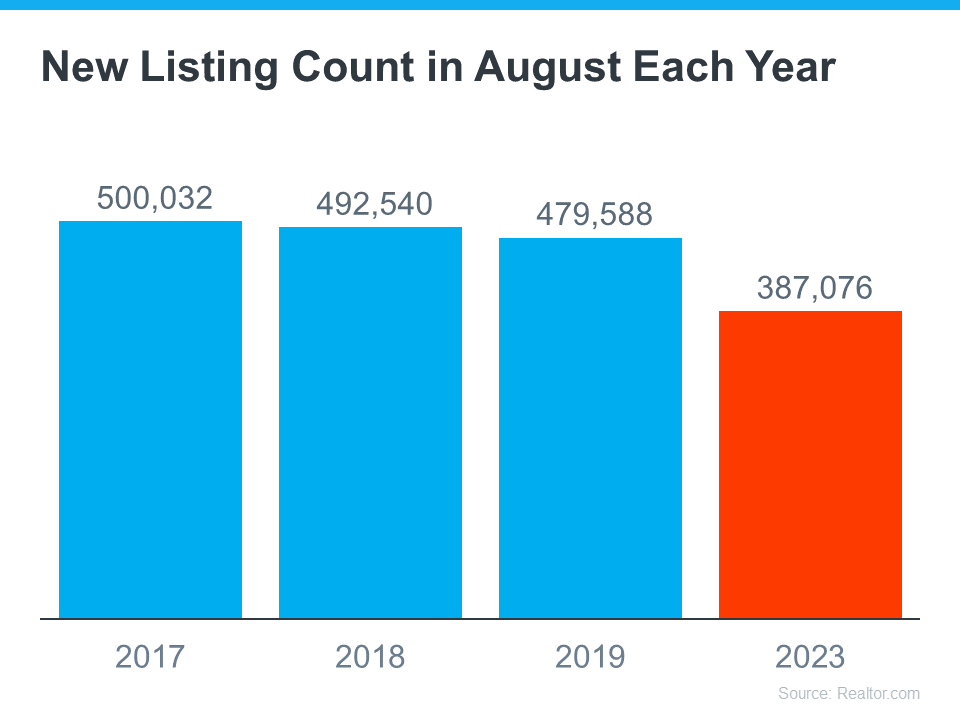
Bottom Line
Even though inventory is still low, you don’t want to wait for more competition to pop up in your neighborhood. You still have an incredible opportunity if you sell your house today. Connect with a real estate agent to explore the benefits of selling now before more homes come to the market.
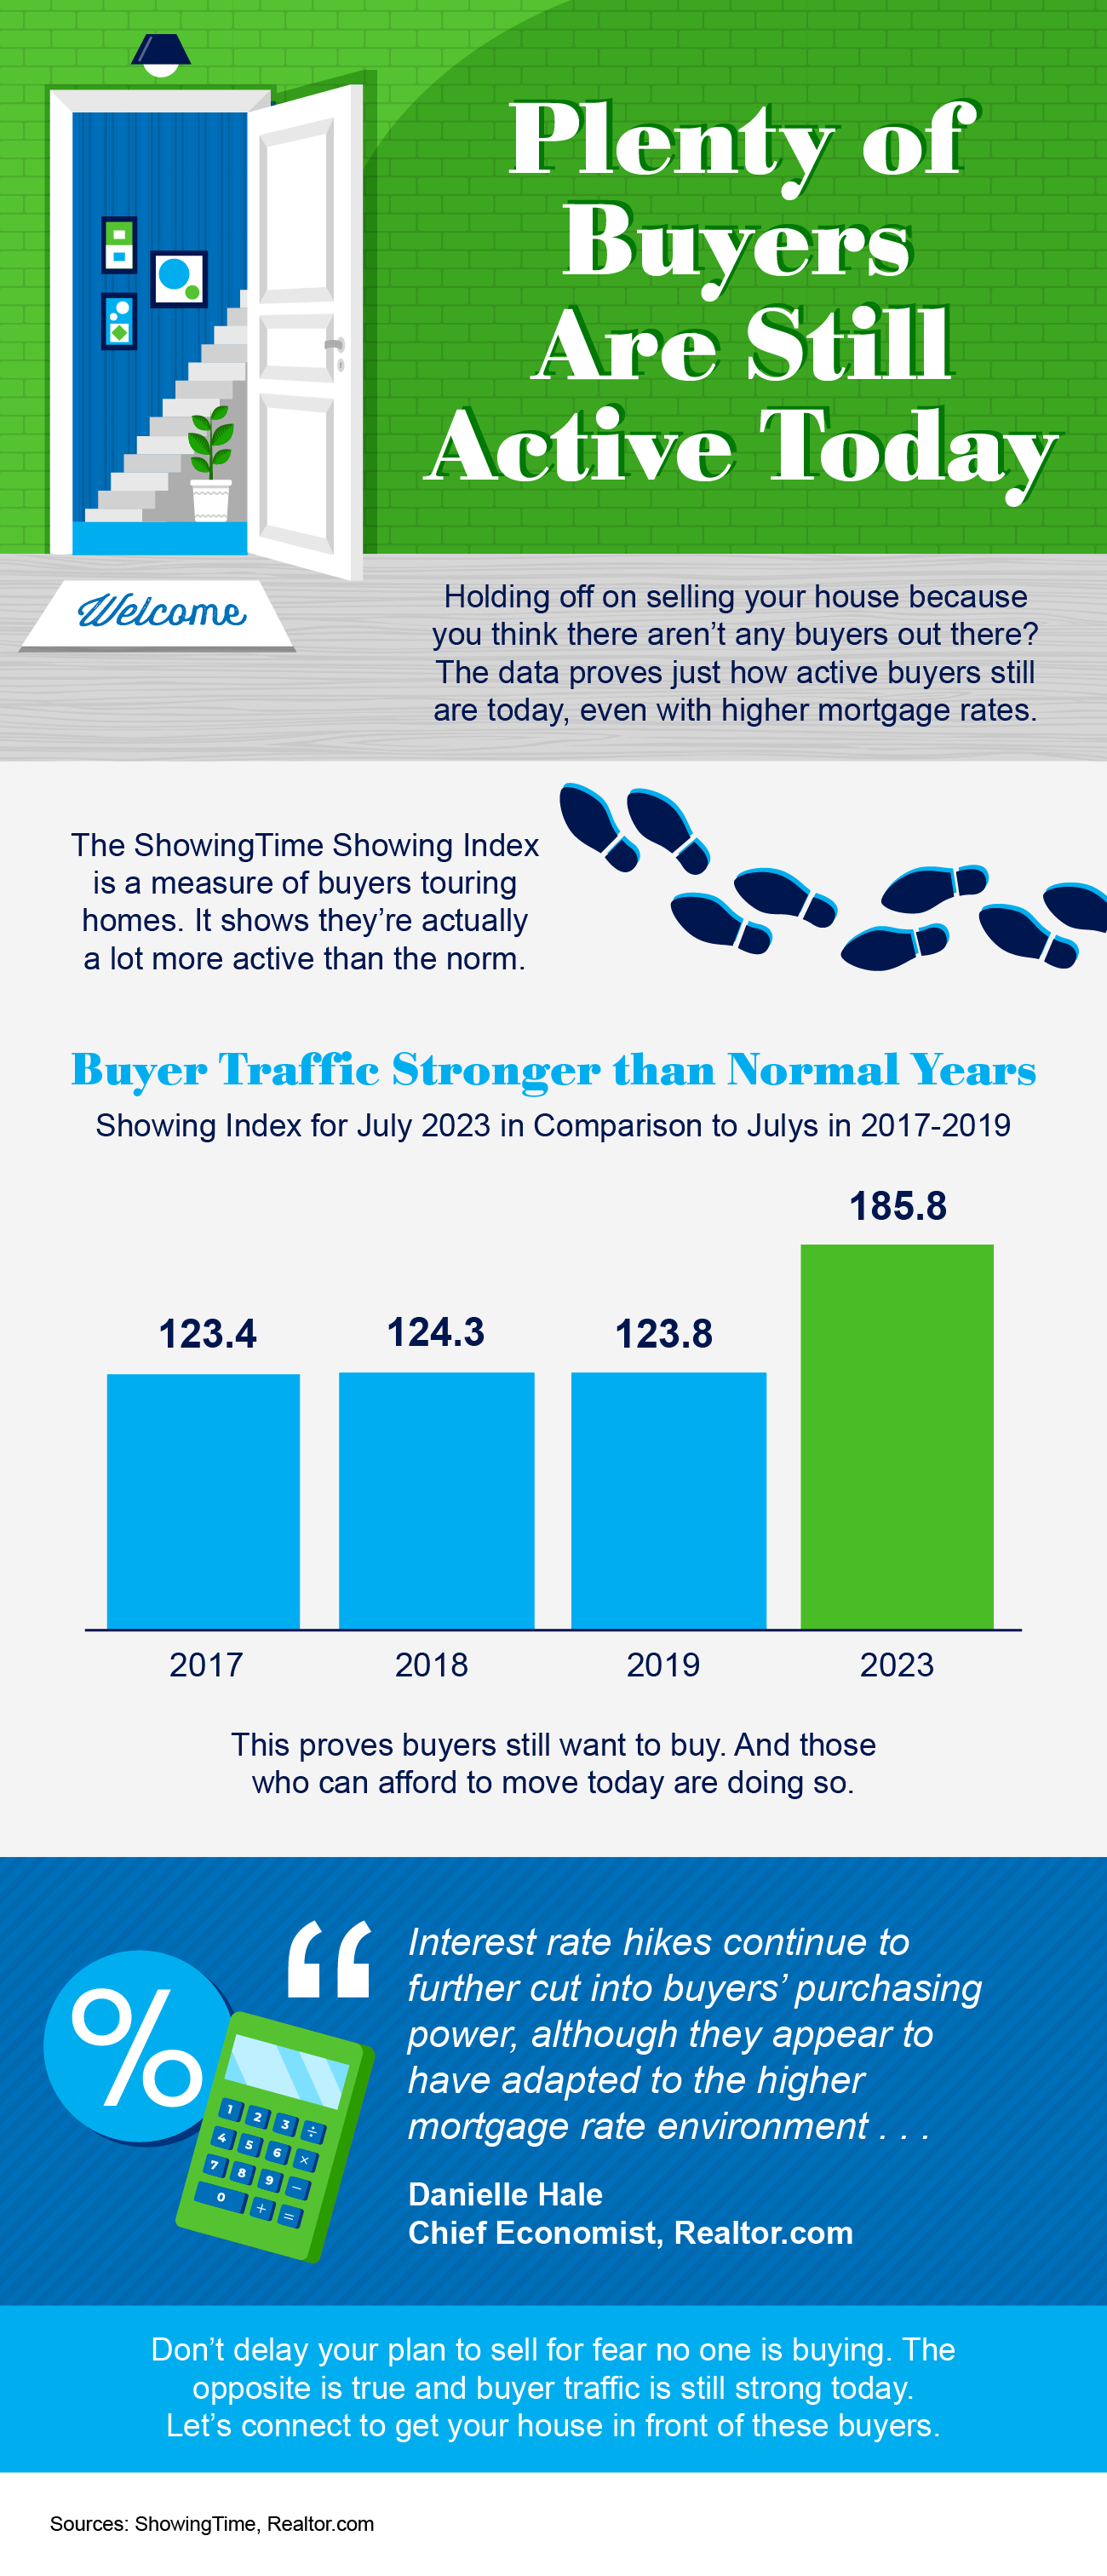
![Plenty of Buyers Are Still Active Today [INFOGRAPHIC] Simplifying The Market](https://terceroagency.com/wp-content/uploads/2023/09/Plenty-of-Buyers-Are-Still-Active-Today-KCM-Share.png)


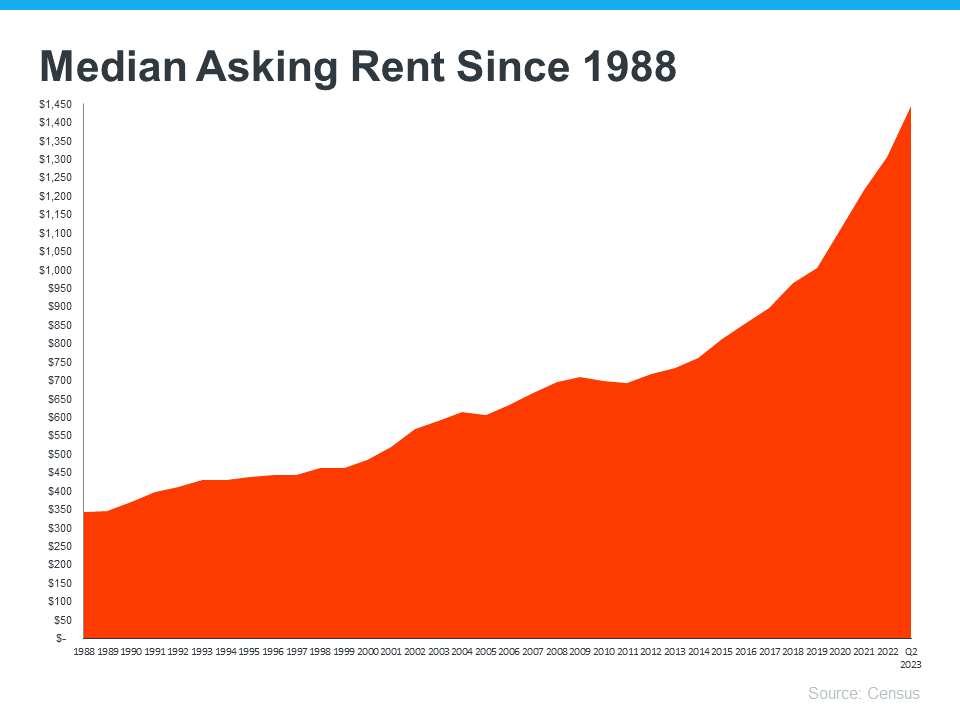 Rents have been going up consistently over the long run. If you choose to rent, there’s a risk your rental payment will go up each time you renew your lease. Having a higher rental expense may not be something you want to deal with every year.
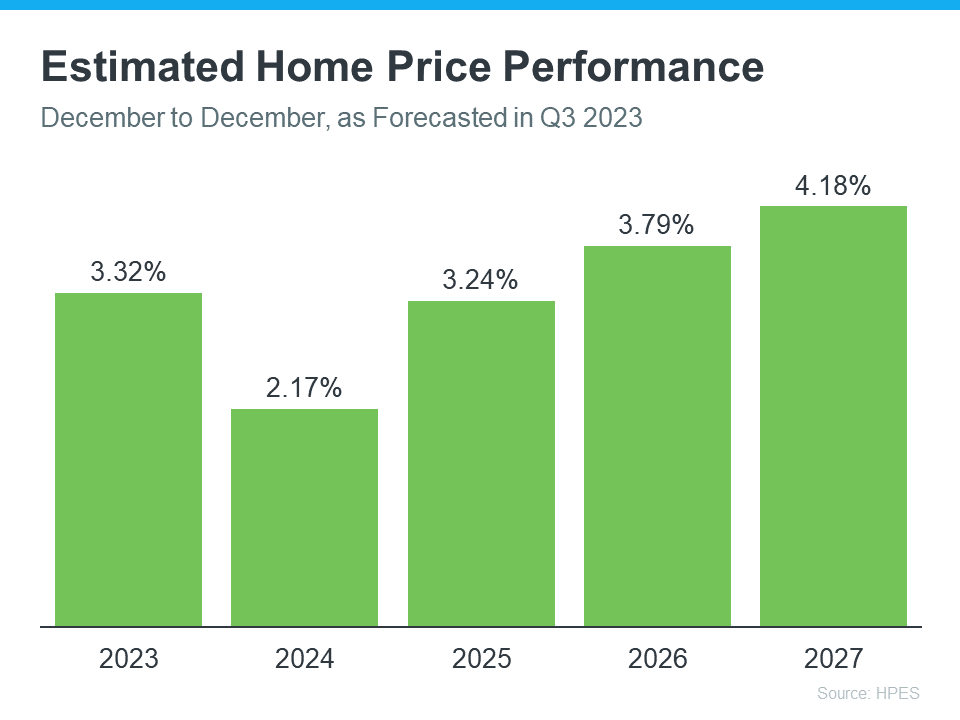 If you’re someone who was worried home prices would fall because of stories you’ve read online, here's the big takeaway. Even though home prices vary by local market, experts project prices will continue to rise across the country for years to come. And these numbers indicate the return to more normal home price appreciation.
 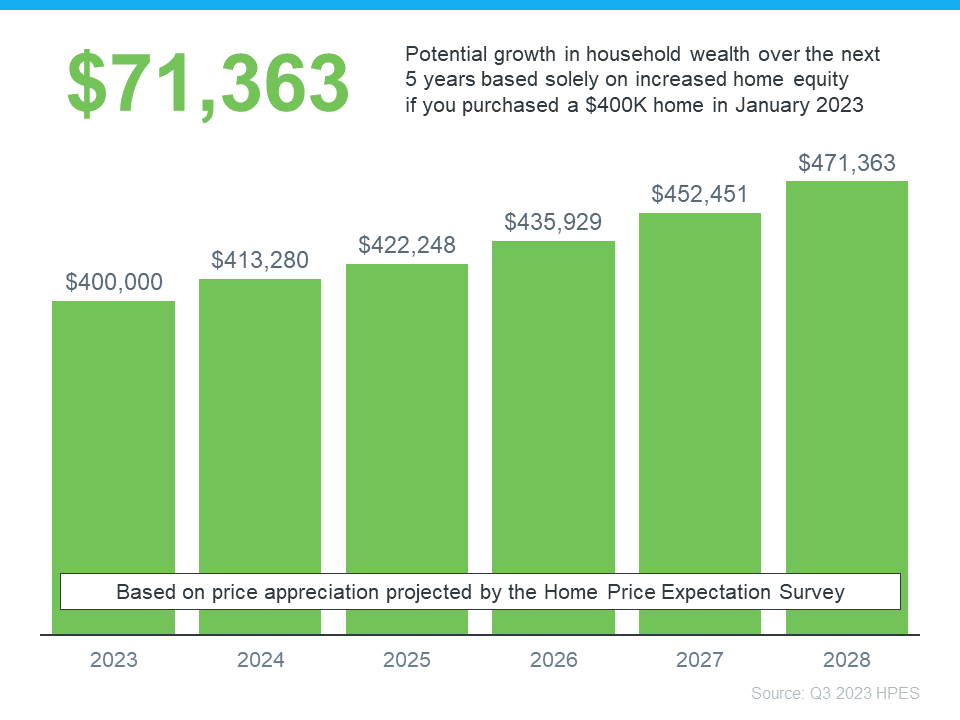 In this example, let’s say you bought a $400,000 home at the beginning of this year. If you factor in the forecast from the HPES, you could potentially accumulate more than $71,000 in household wealth over the next five years.
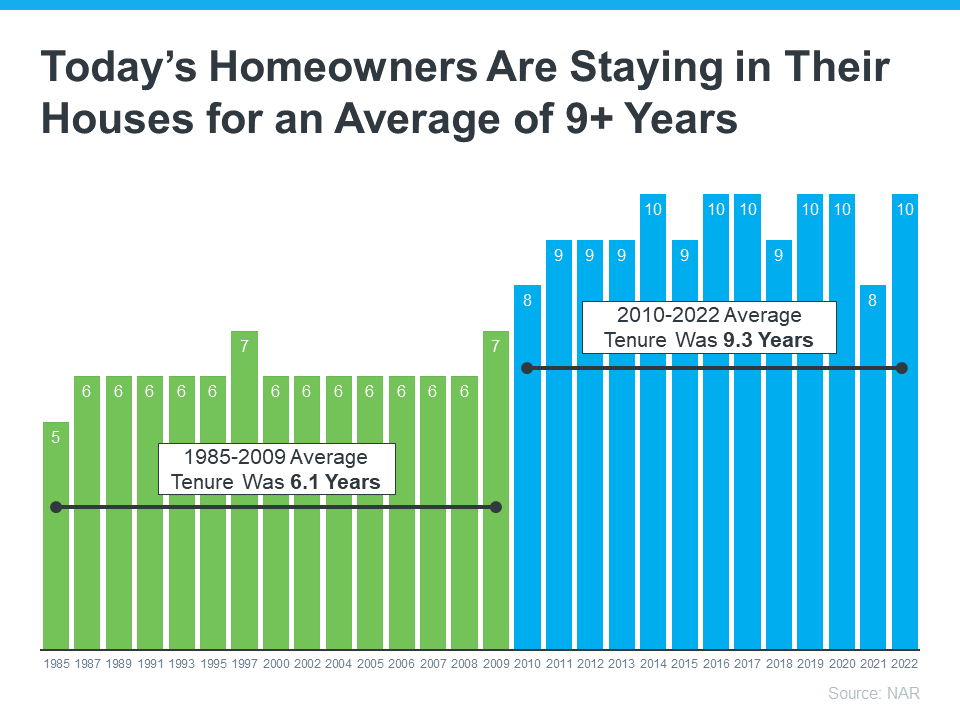 This means many homeowners have been living in their houses even longer in recent years. When you live in a home for such a significant amount of time, it’s natural for you to experience changes in your life while you’re in that house. As those life changes and milestones happen, your needs may change. And if your current home no longer meets them, you may have better options waiting for you.
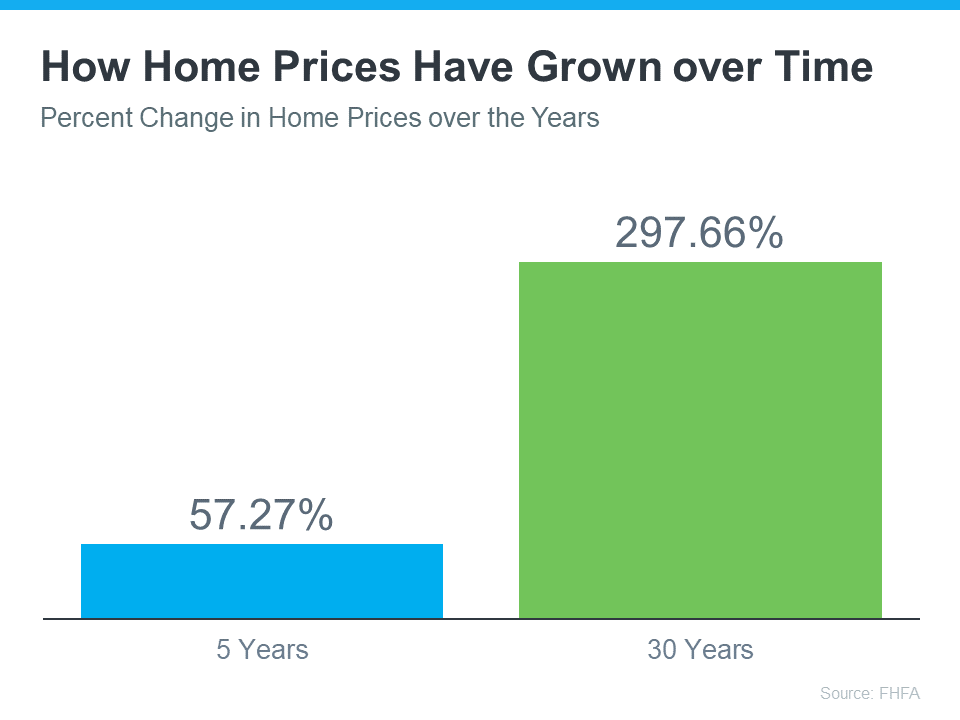 While home prices vary by area, the national average shows the typical homeowner who’s been in their house for five years saw it increase in value by nearly 60%. And the average homeowner who’s owned their home for 30 years saw it almost triple in value over that time.
![Home Price Forecasts Revised for 2023 [INFOGRAPHIC] Simplifying The Market](https://terceroagency.com/wp-content/uploads/2023/09/Home-Price-Forecasts-Revised-for-2023-KCM-Share.png)

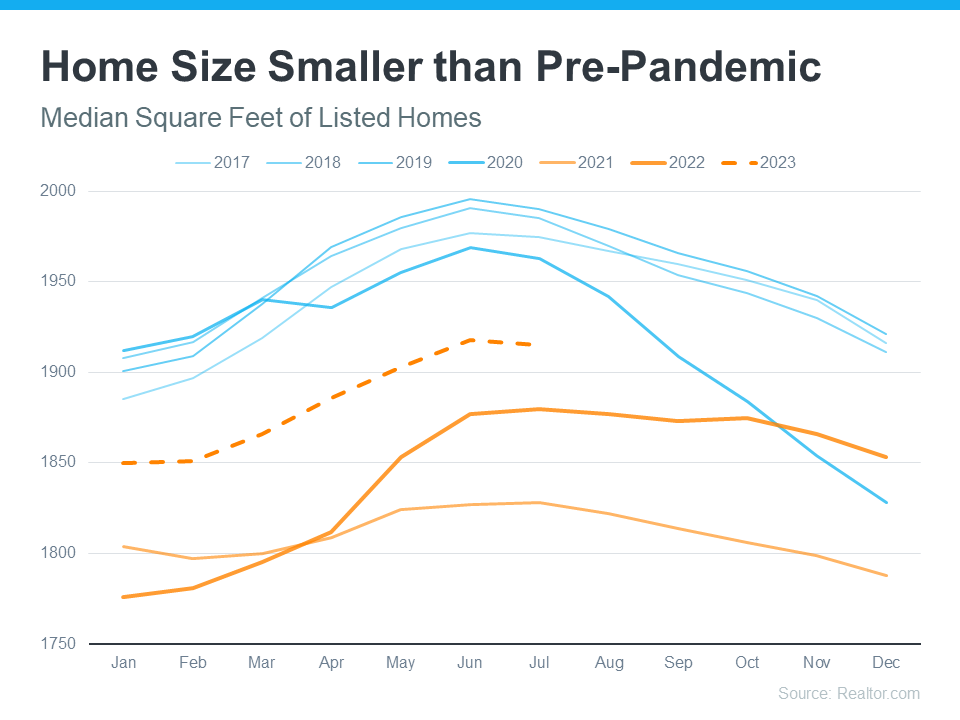 This graph also shows how the size of homes on the market changes seasonally. Larger homes tend to come on the market during the summer months when households with children who are out of school are looking to move.
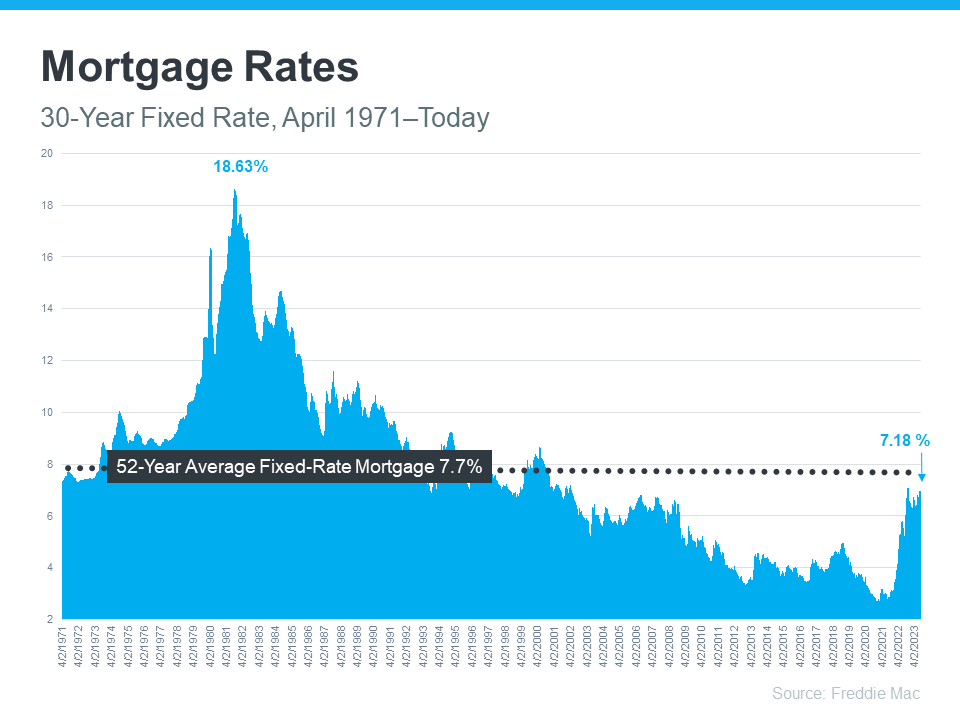 Looking at the right side of the graph, mortgage rates have increased significantly since the start of last year. But even with that rise, today’s rates are still below the 52-year average. While that historical perspective is good context, buyers have gotten used to mortgage rates between 3% and 5%, which is where they’ve been over the past 15 years.
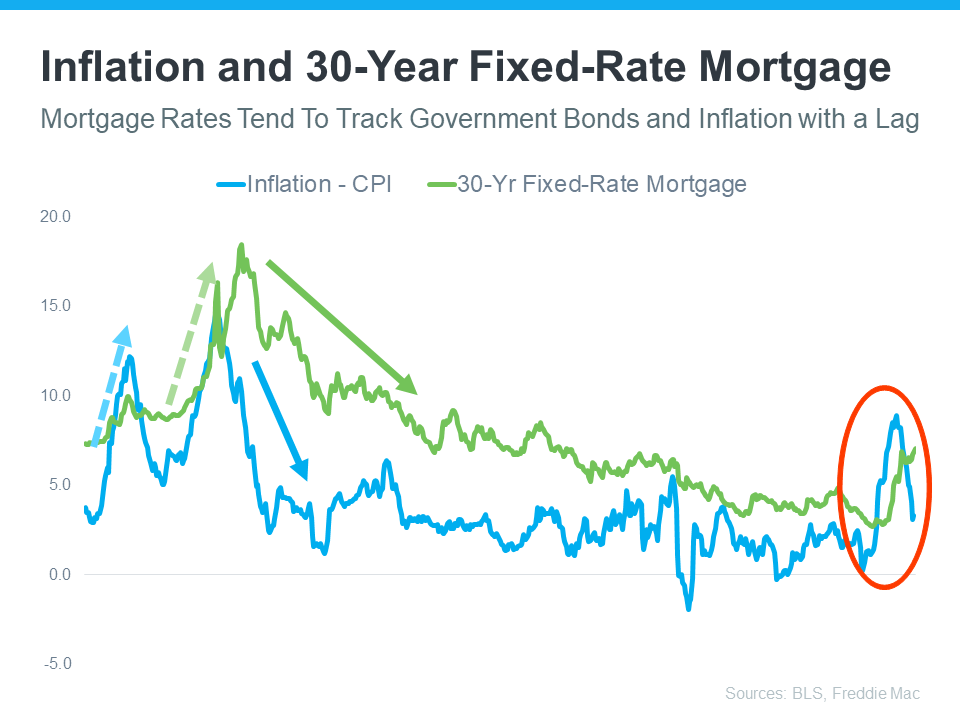 This graph shows a pretty reliable relationship between inflation and mortgage rates. Looking at the left side of the graph, each time inflation moves significantly (shown in blue), mortgage rates follow suit shortly after (shown in green).
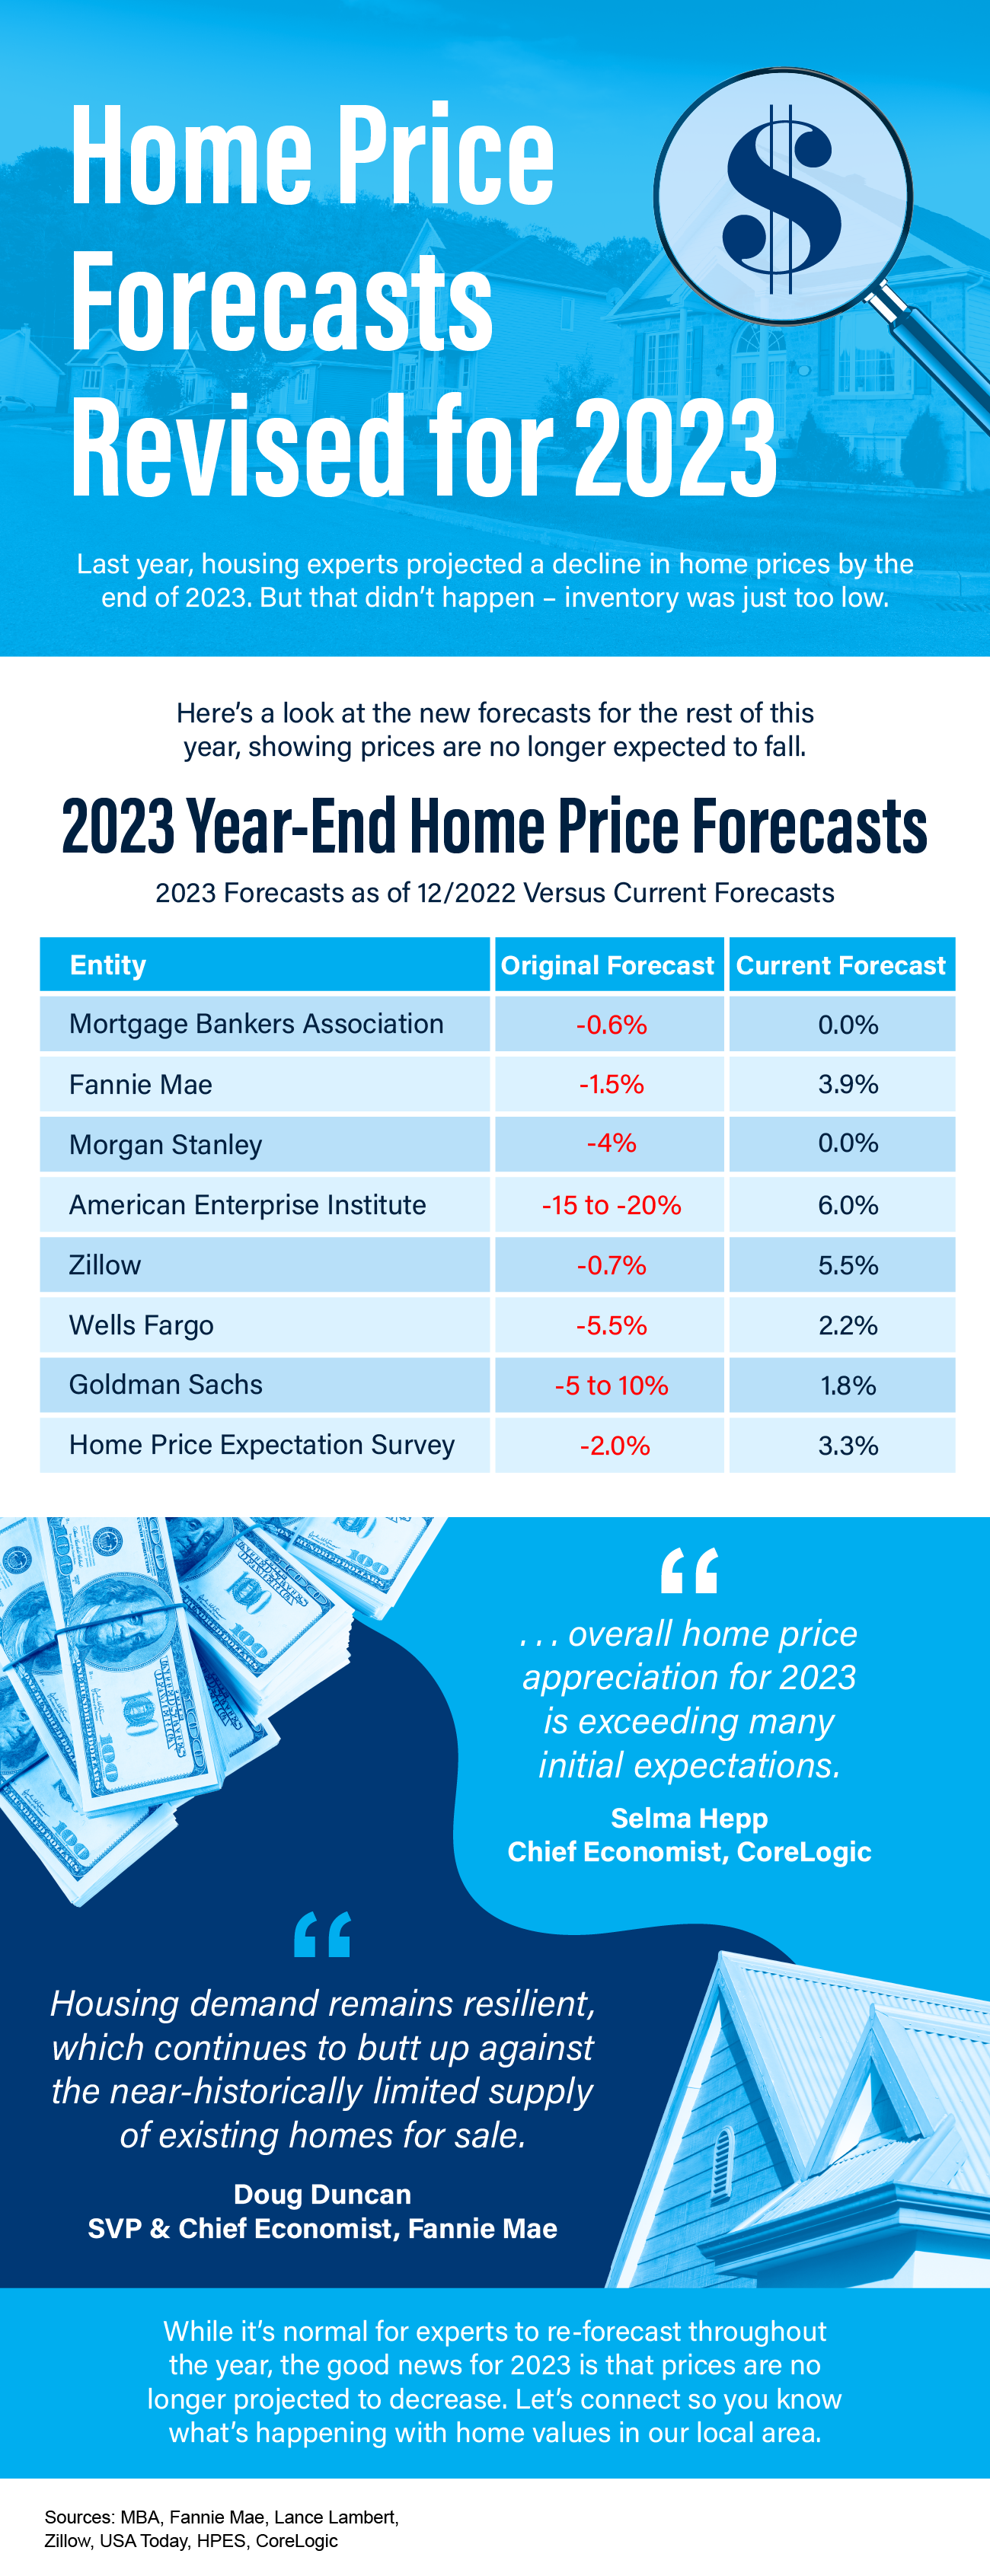
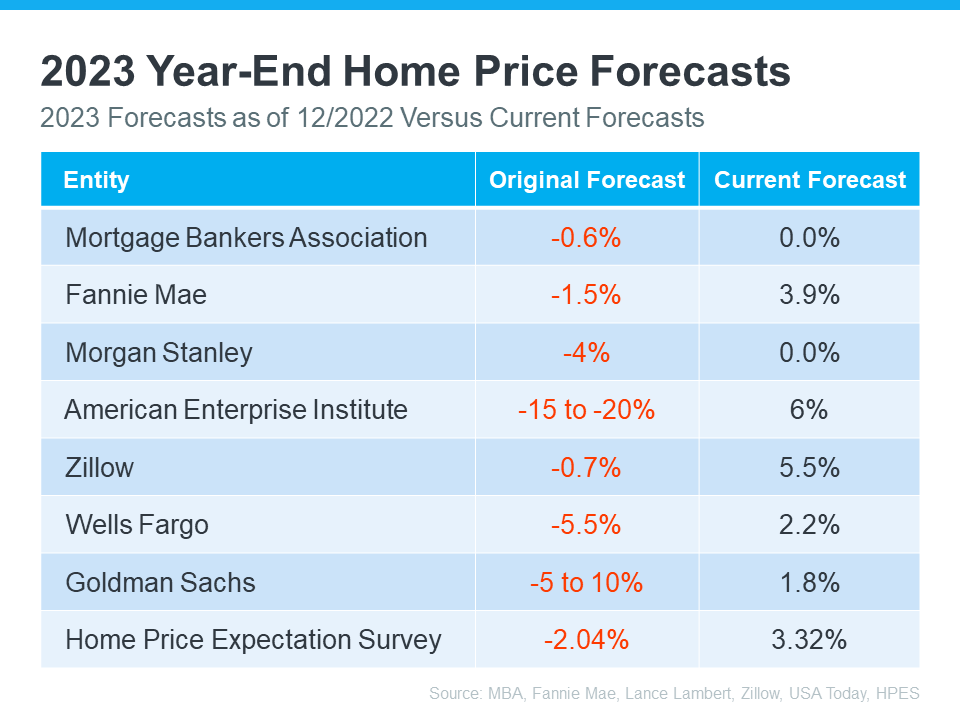 As the red in the middle column shows, in all instances, their original forecast called for home prices to fall. But, if you look at the right column, you’ll see all experts have updated their projections for the year-end to show they expect prices to either be flat or have positive growth. That’s a significant change from the original negative numbers.