
If you’re planning to buy a home this year, you may be focused on the spring market. And hoping that when spring does hit, you’ll see:
- Mortgage rates drop a little more.
- More homes hit the market.
But here’s what most buyers don’t realize. Buying just a few weeks earlier could mean paying less, dealing with less stress, and feeling less rushed.
Here are three reasons why accelerating your timeline over the next few weeks could actually be a better play.
1. Holding Out for Lower Rates May Not Pay Off
A lot of buyers are hoping mortgage rates will fall even further. But that’s not the best strategy. Here’s why. Experts are pretty aligned on this: rates are expected to stay roughly where they are.
Forecasts throughout the industry all point to the same thing: rates are projected to be in the low-6% range this year (see graph below):
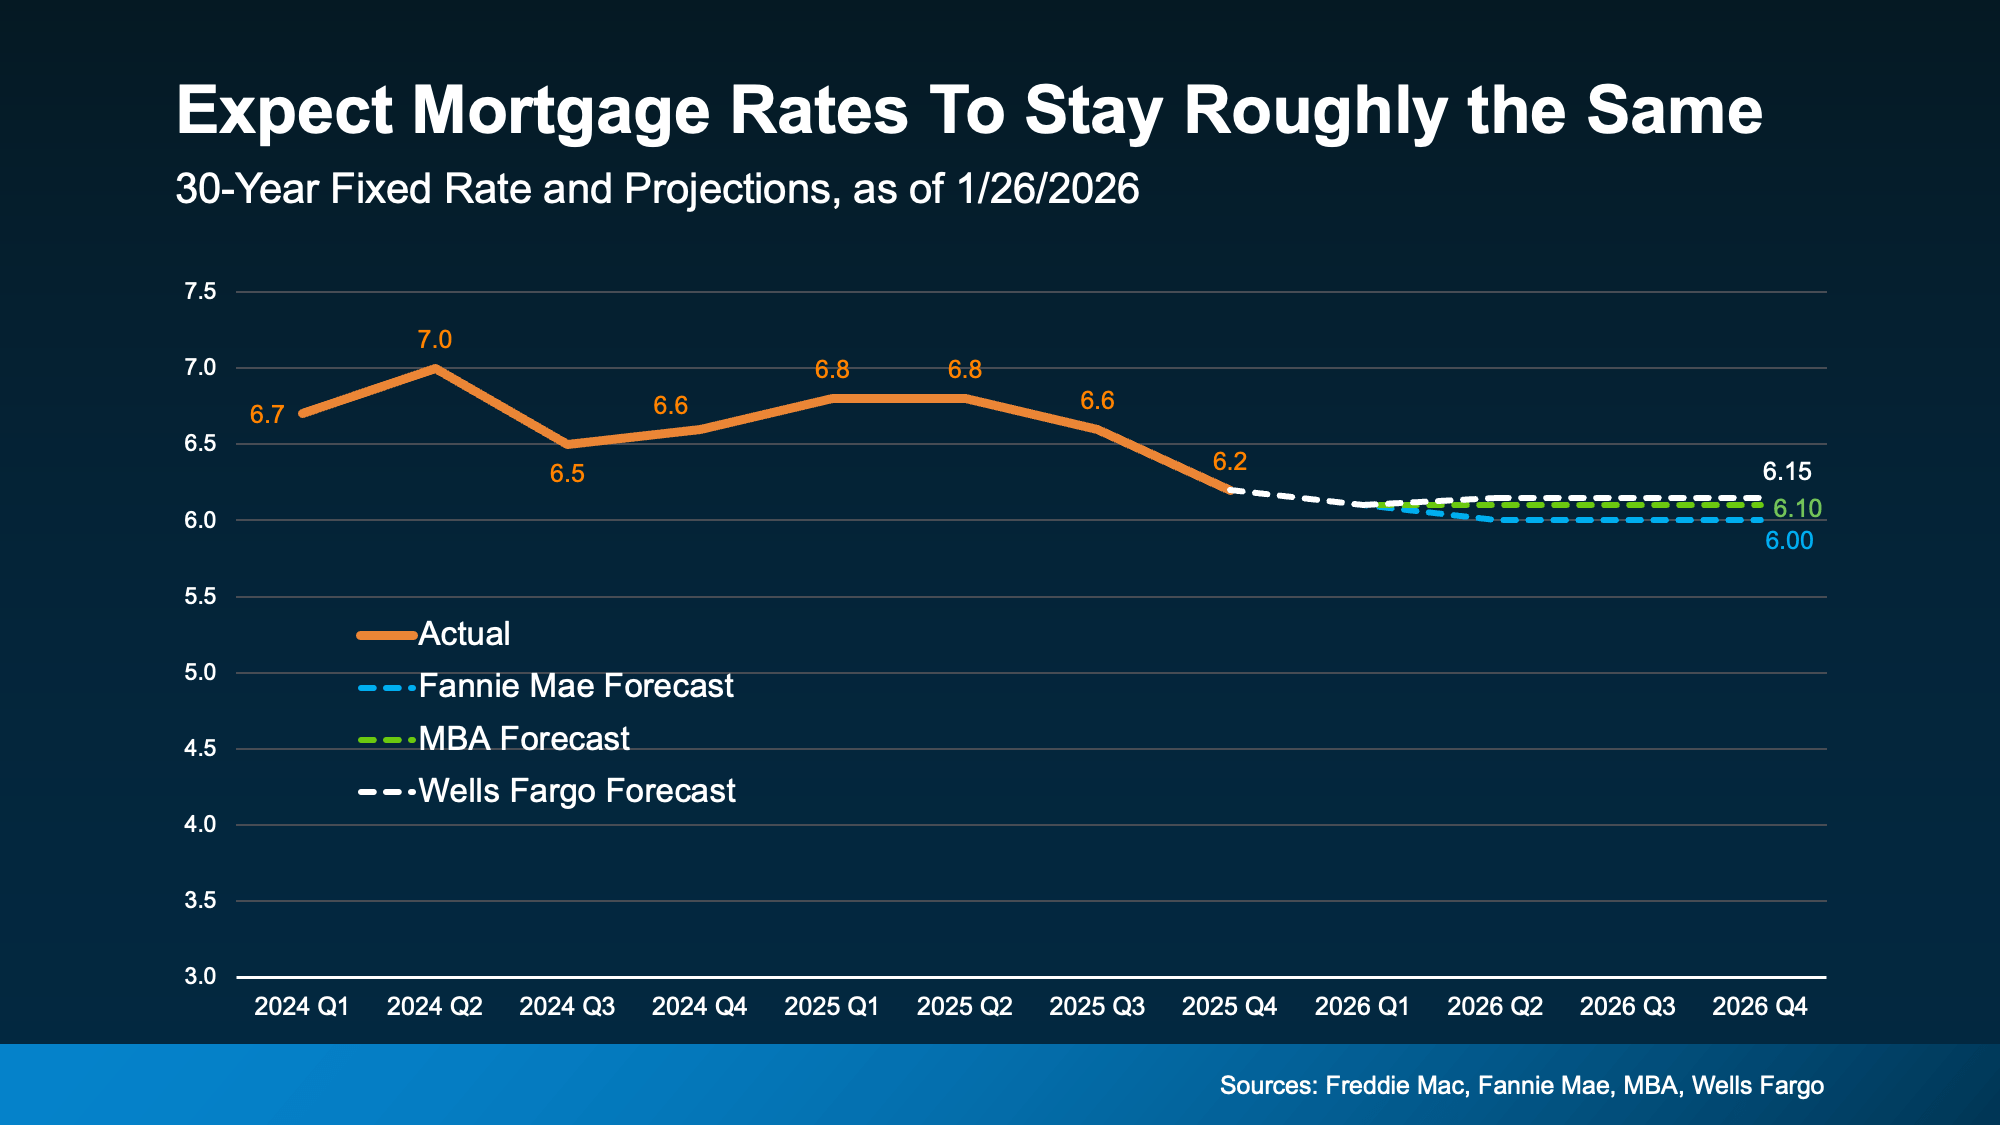 That's not a bad thing, especially if you consider how much rates have already come down. Over the past 12 months, they’ve dropped roughly a full percentage point. And for many buyers, that means affordability has already improved more than they may realize.
So why wait a few more weeks just for more buyers to jump in and act as your competition? You already have a window right now. As Chen Zhao, Head of Economics Research at Redfin, explains:
“House hunters should know that this may be near the lowest mortgage rates fall for the foreseeable future.”
2. Spring Means More Competition + More Stress
Speaking of competition, the spring market is popular for a reason, but with popularity comes pressure. With more buyers active at that time of year, you’ll have to move faster once you find a home you like. And no one likes feeling rushed.
But buy now and you have more time to browse. Fewer people are looking, so homes sit longer.
You can see this play out in the data from Realtor.com (see graph below). In winter months, it takes an average of about 70 days for a home to sell. In spring? That drops to about 50 days. That’s a 20-day swing – and that pace is going to be more stressful.
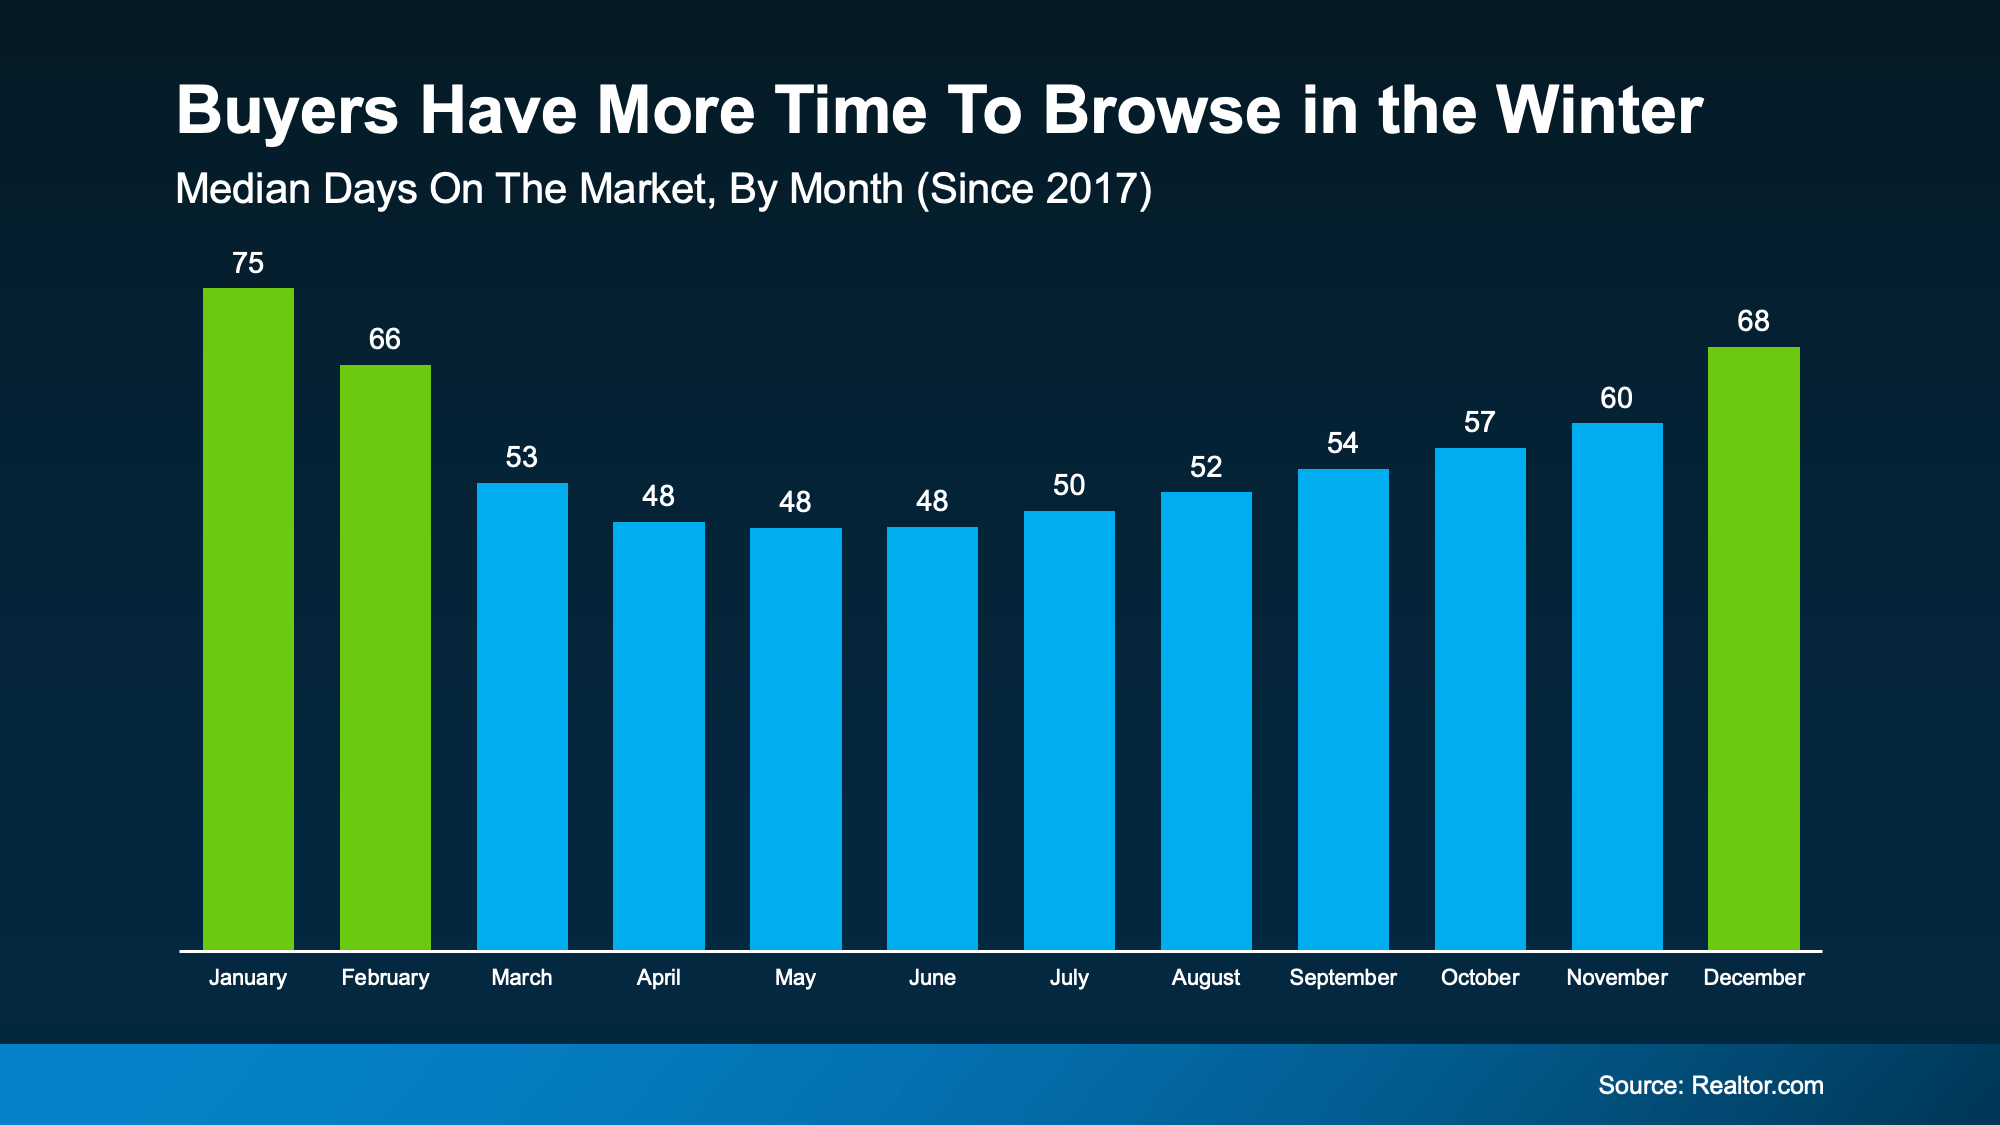 Homes sell faster in the spring, and slower in the winter. And that can be a worthwhile perk for buyers who want to get ahead before their decisions start to feel rushed.
3. Prices Tend To Rise When Competition Heats Up
And here’s something most buyers forget to factor in. Prices usually respond to demand. So, when demand is higher, prices are too. Bankrate explains:
“Spring and early summer are the busiest and most competitive time of year for the real estate market . . . home prices tend to be steeper to reflect the increased demand.”
In fact, data from the National Association of Realtors (NAR) shows that in 2025, buyers who purchased in the beginning of the year saved roughly $30,000–$35,000 compared to those who bought when prices peaked in the spring or early summer.
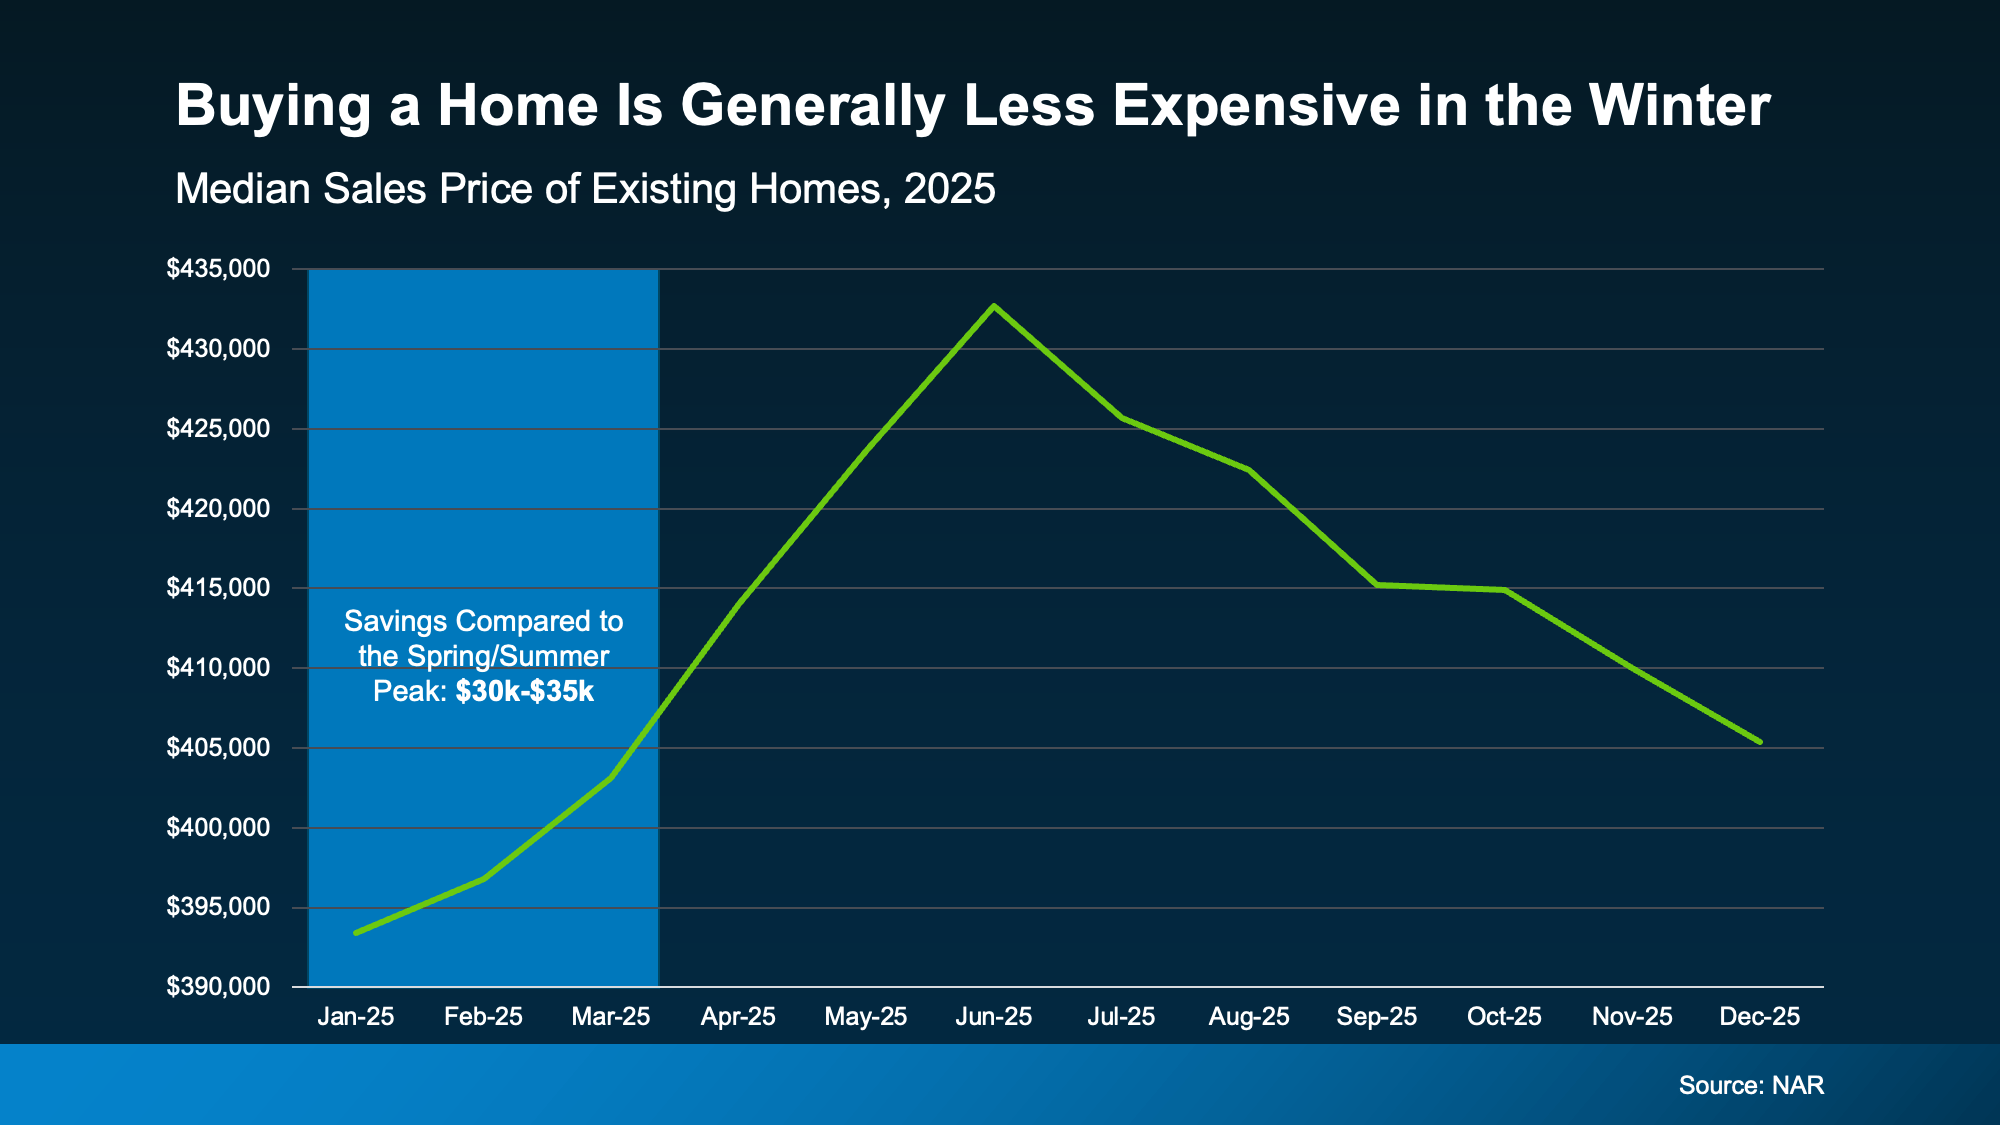 And let’s be honest, for a lot of buyers today, every little bit of savings helps. That’s why buying just a few weeks earlier, before prices ramp up, will be better for you and your wallet.
Bottom Line
Buying a few weeks before spring isn’t about rushing. It’s about choosing to be ahead of the curve and knowing you want more leverage, less stress, and meaningful savings.
If you’re ready and able to buy now and want to get the ball rolling, connect with a local agent.
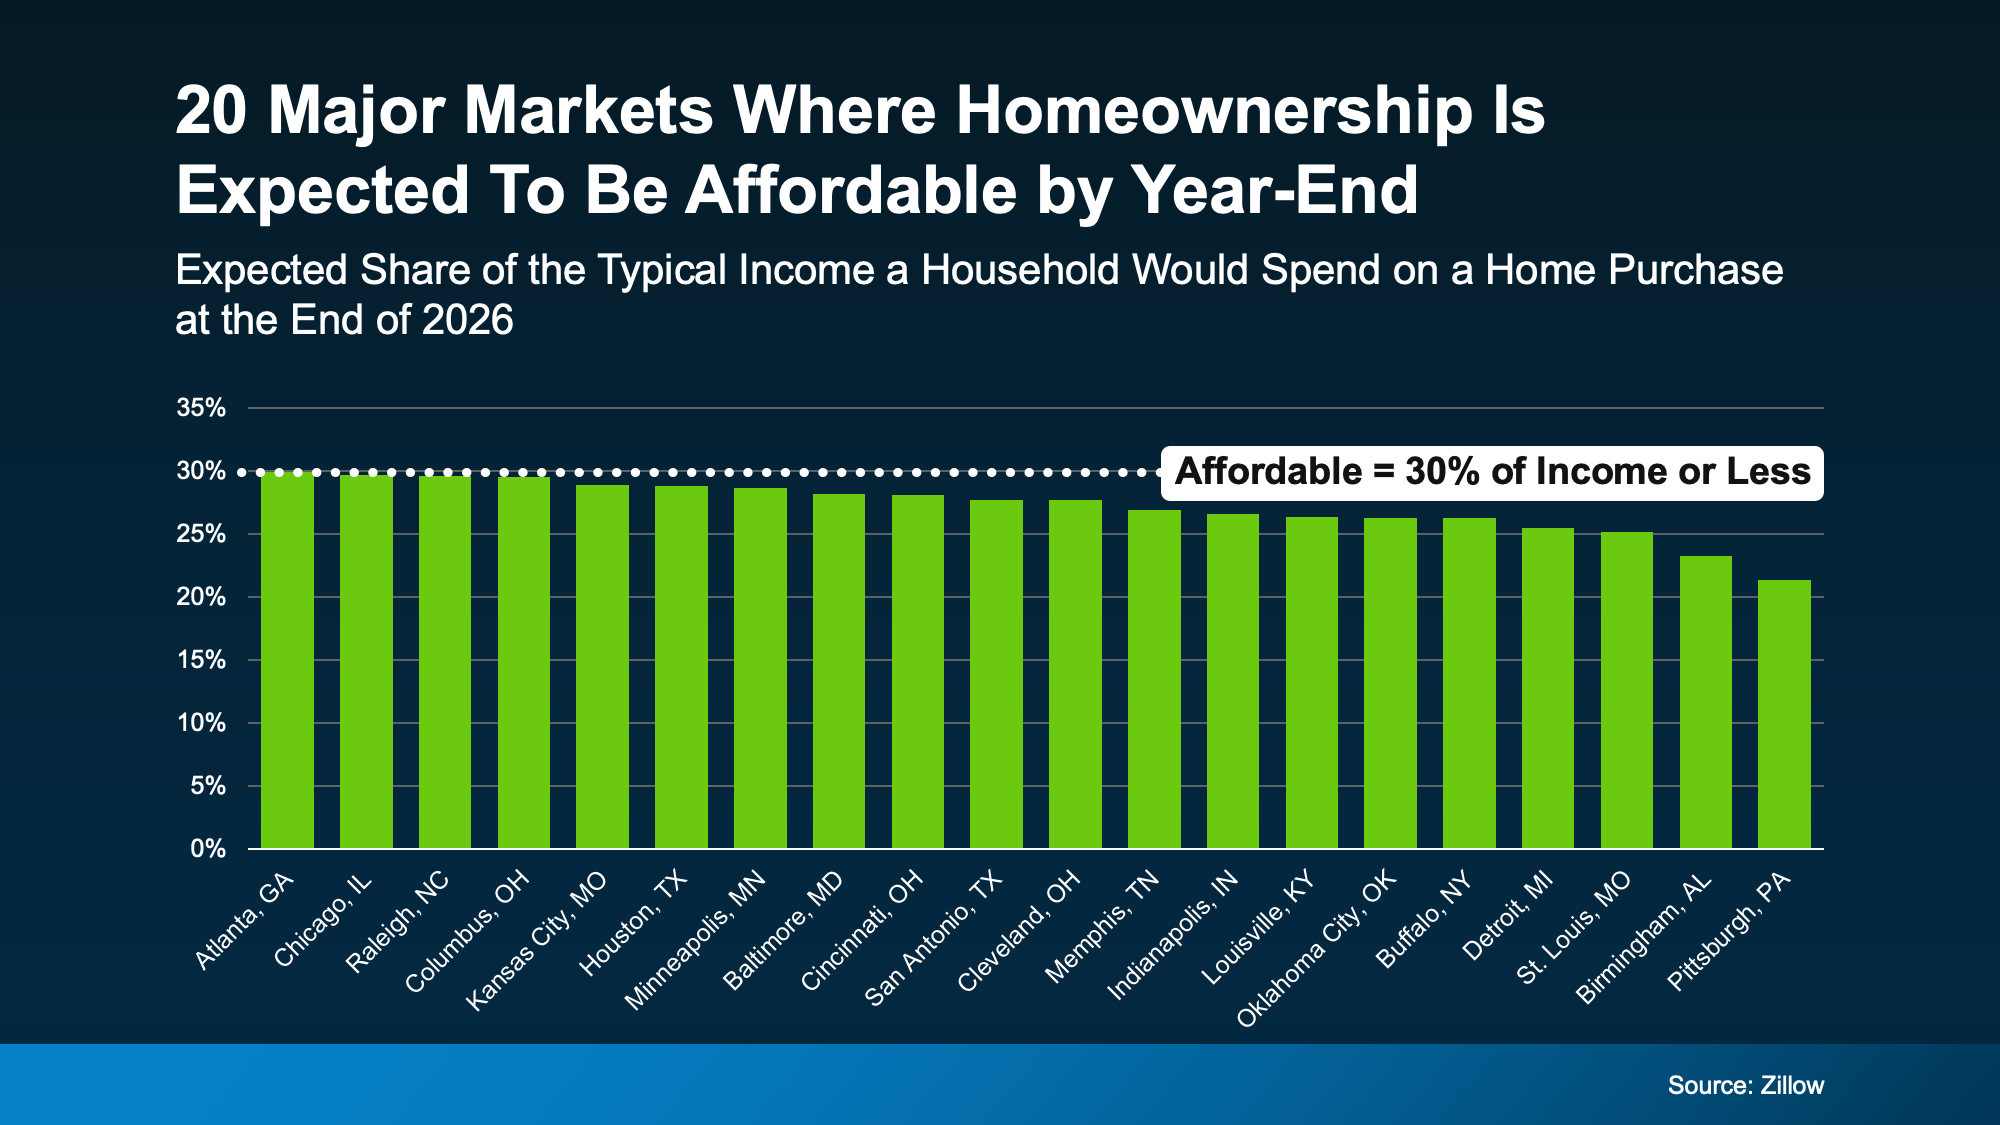
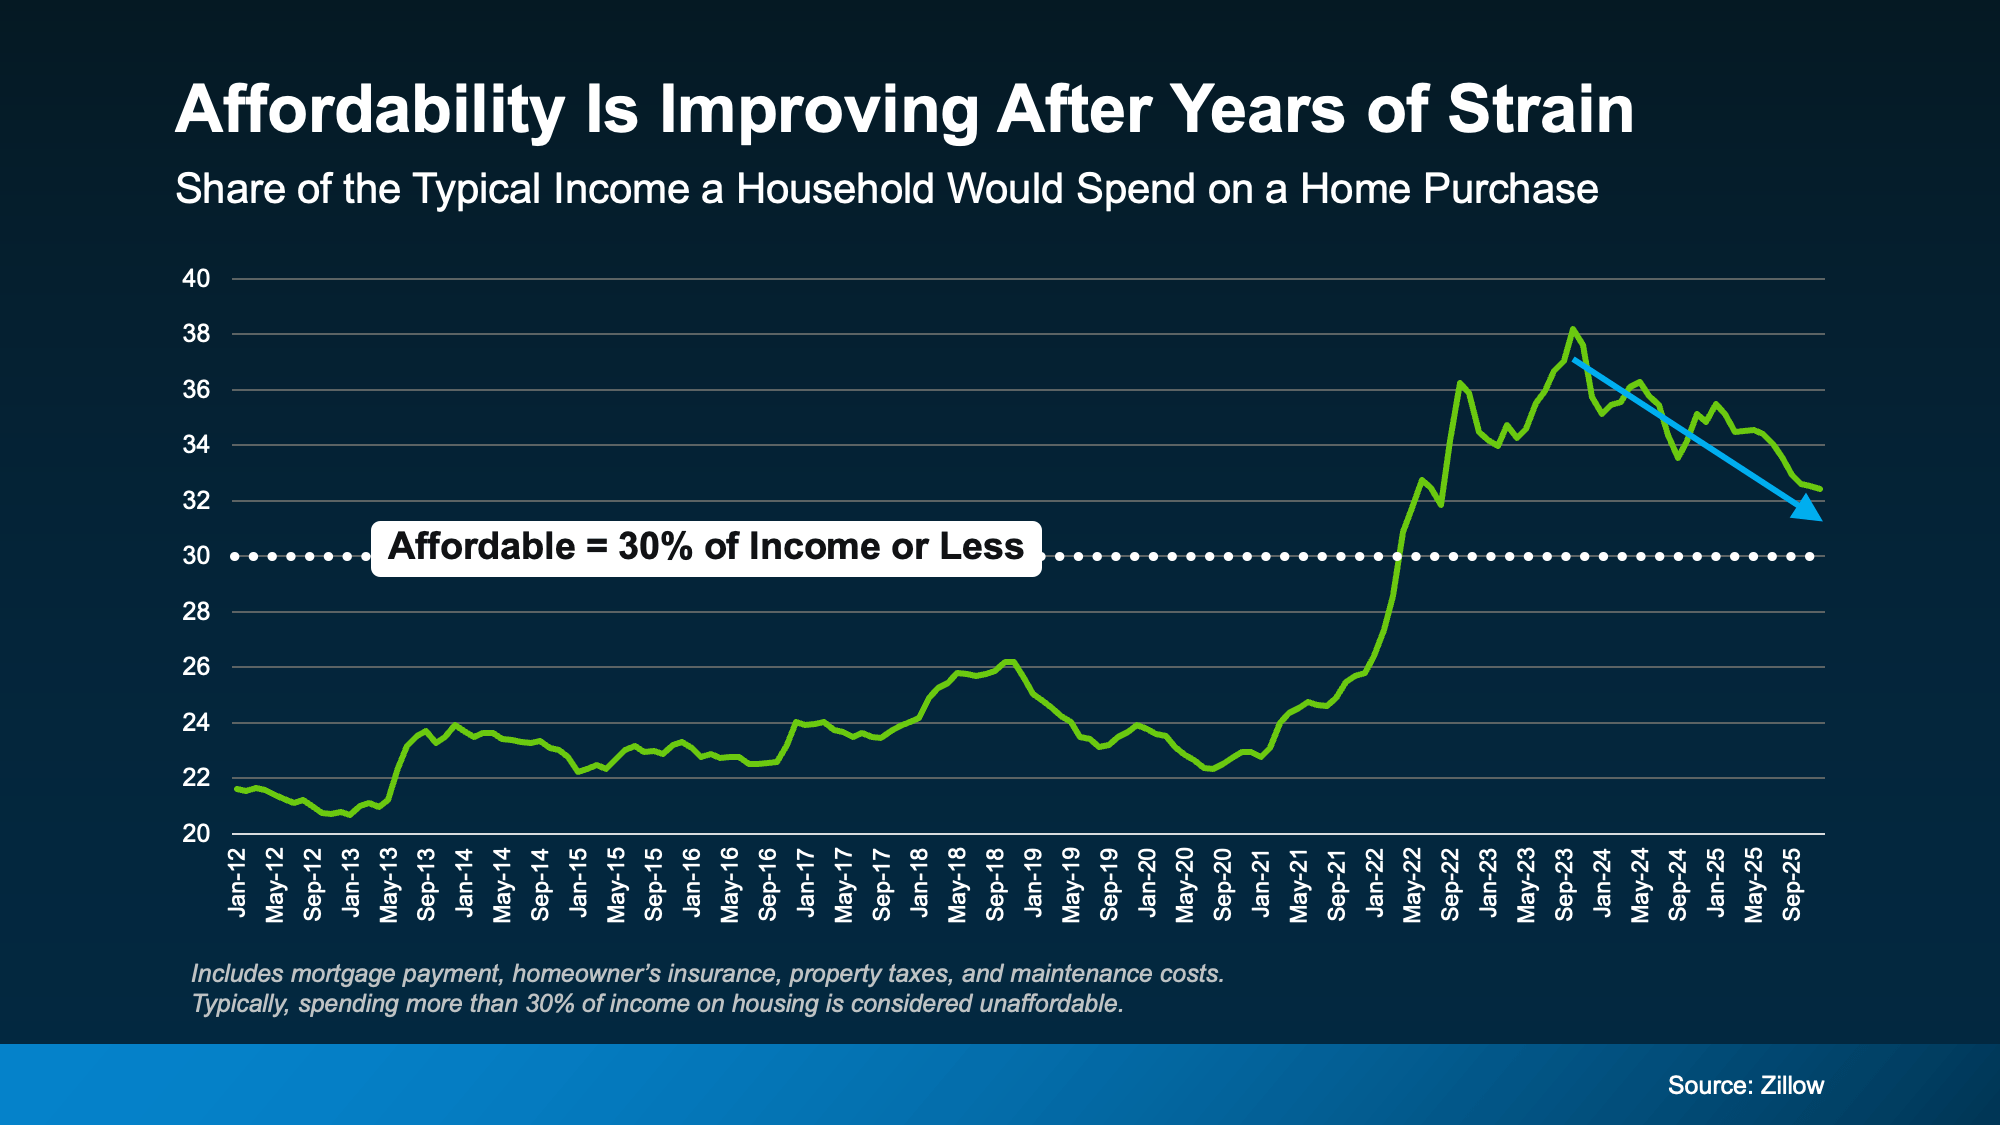 Now, we’re not all the way back to Zillow’s threshold of 30% of your income or less, so affordability is still tight. But things are trending in the right direction.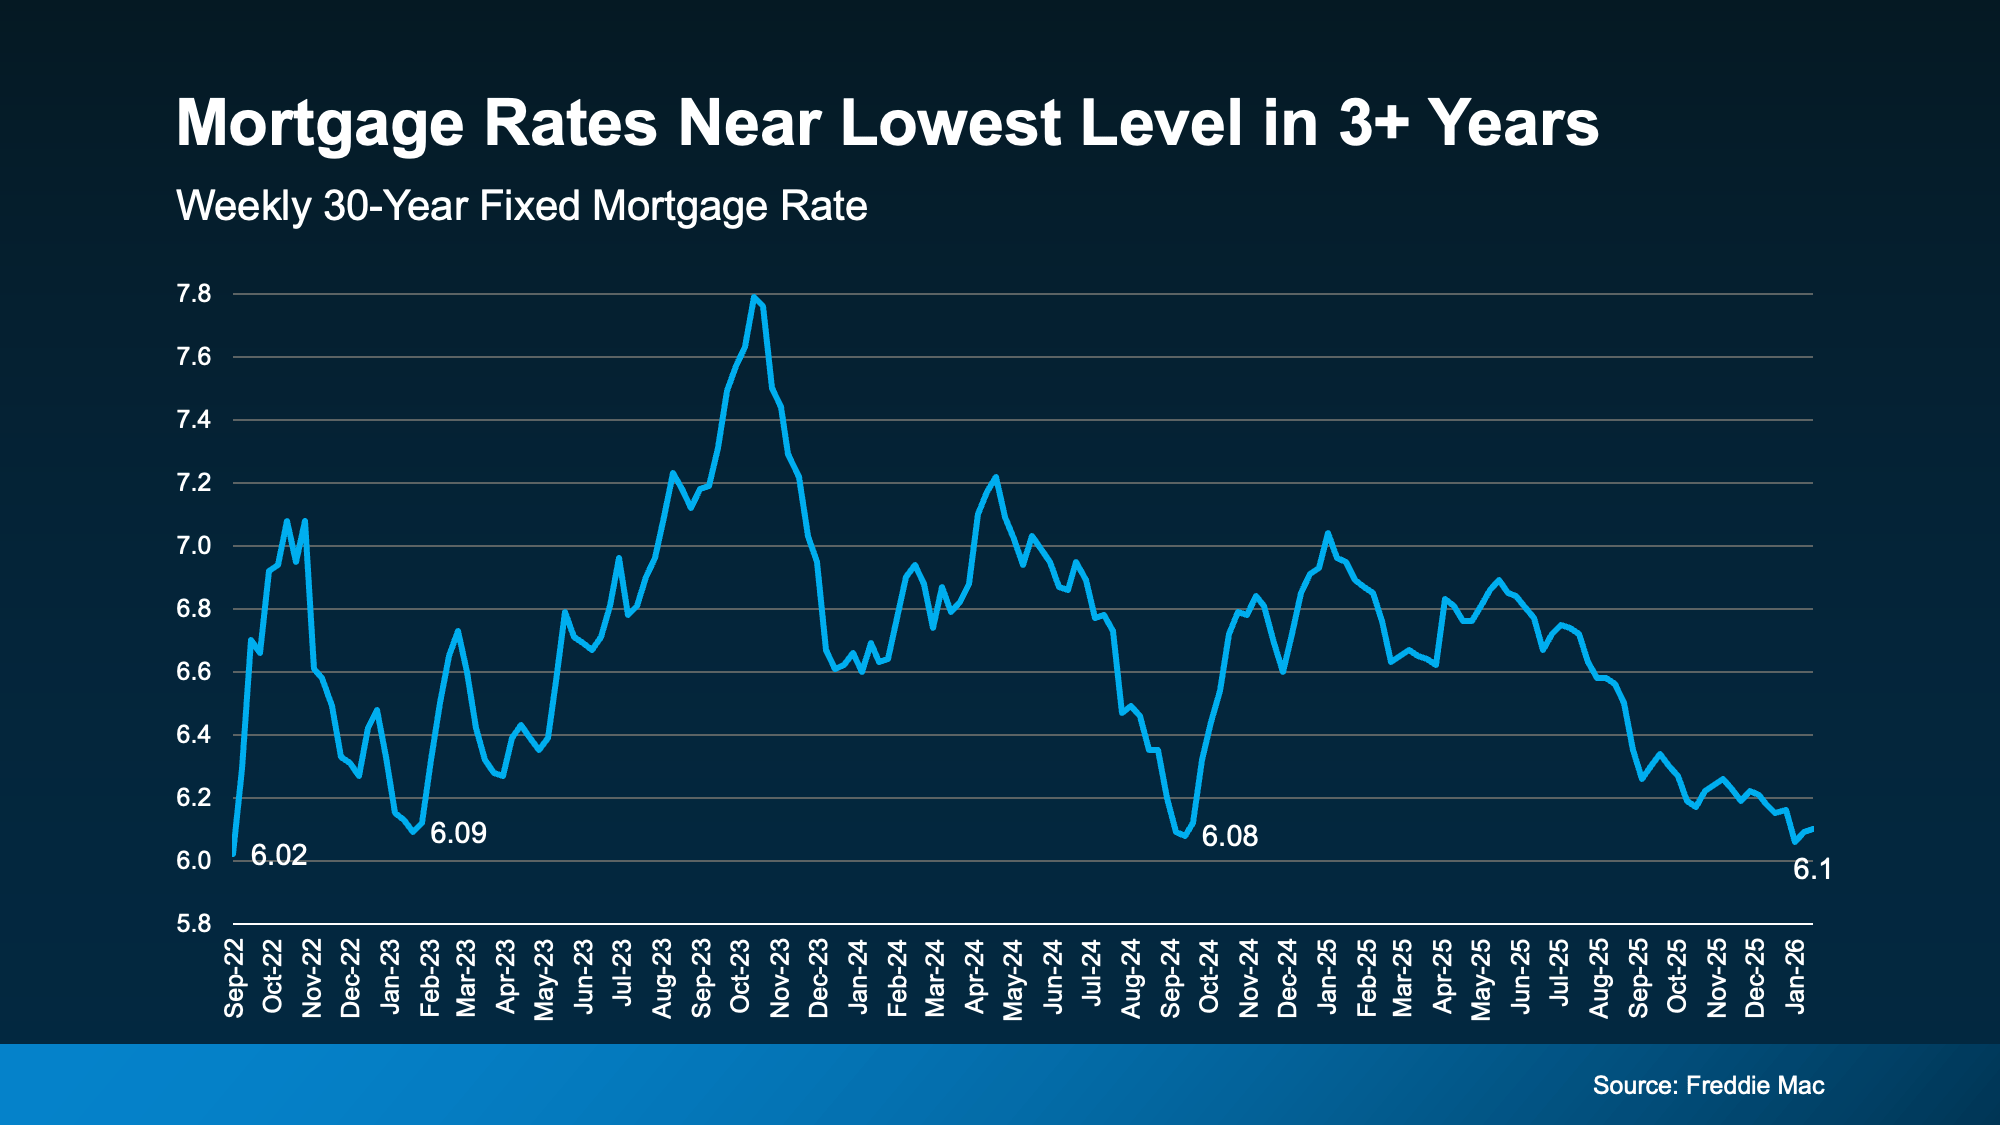

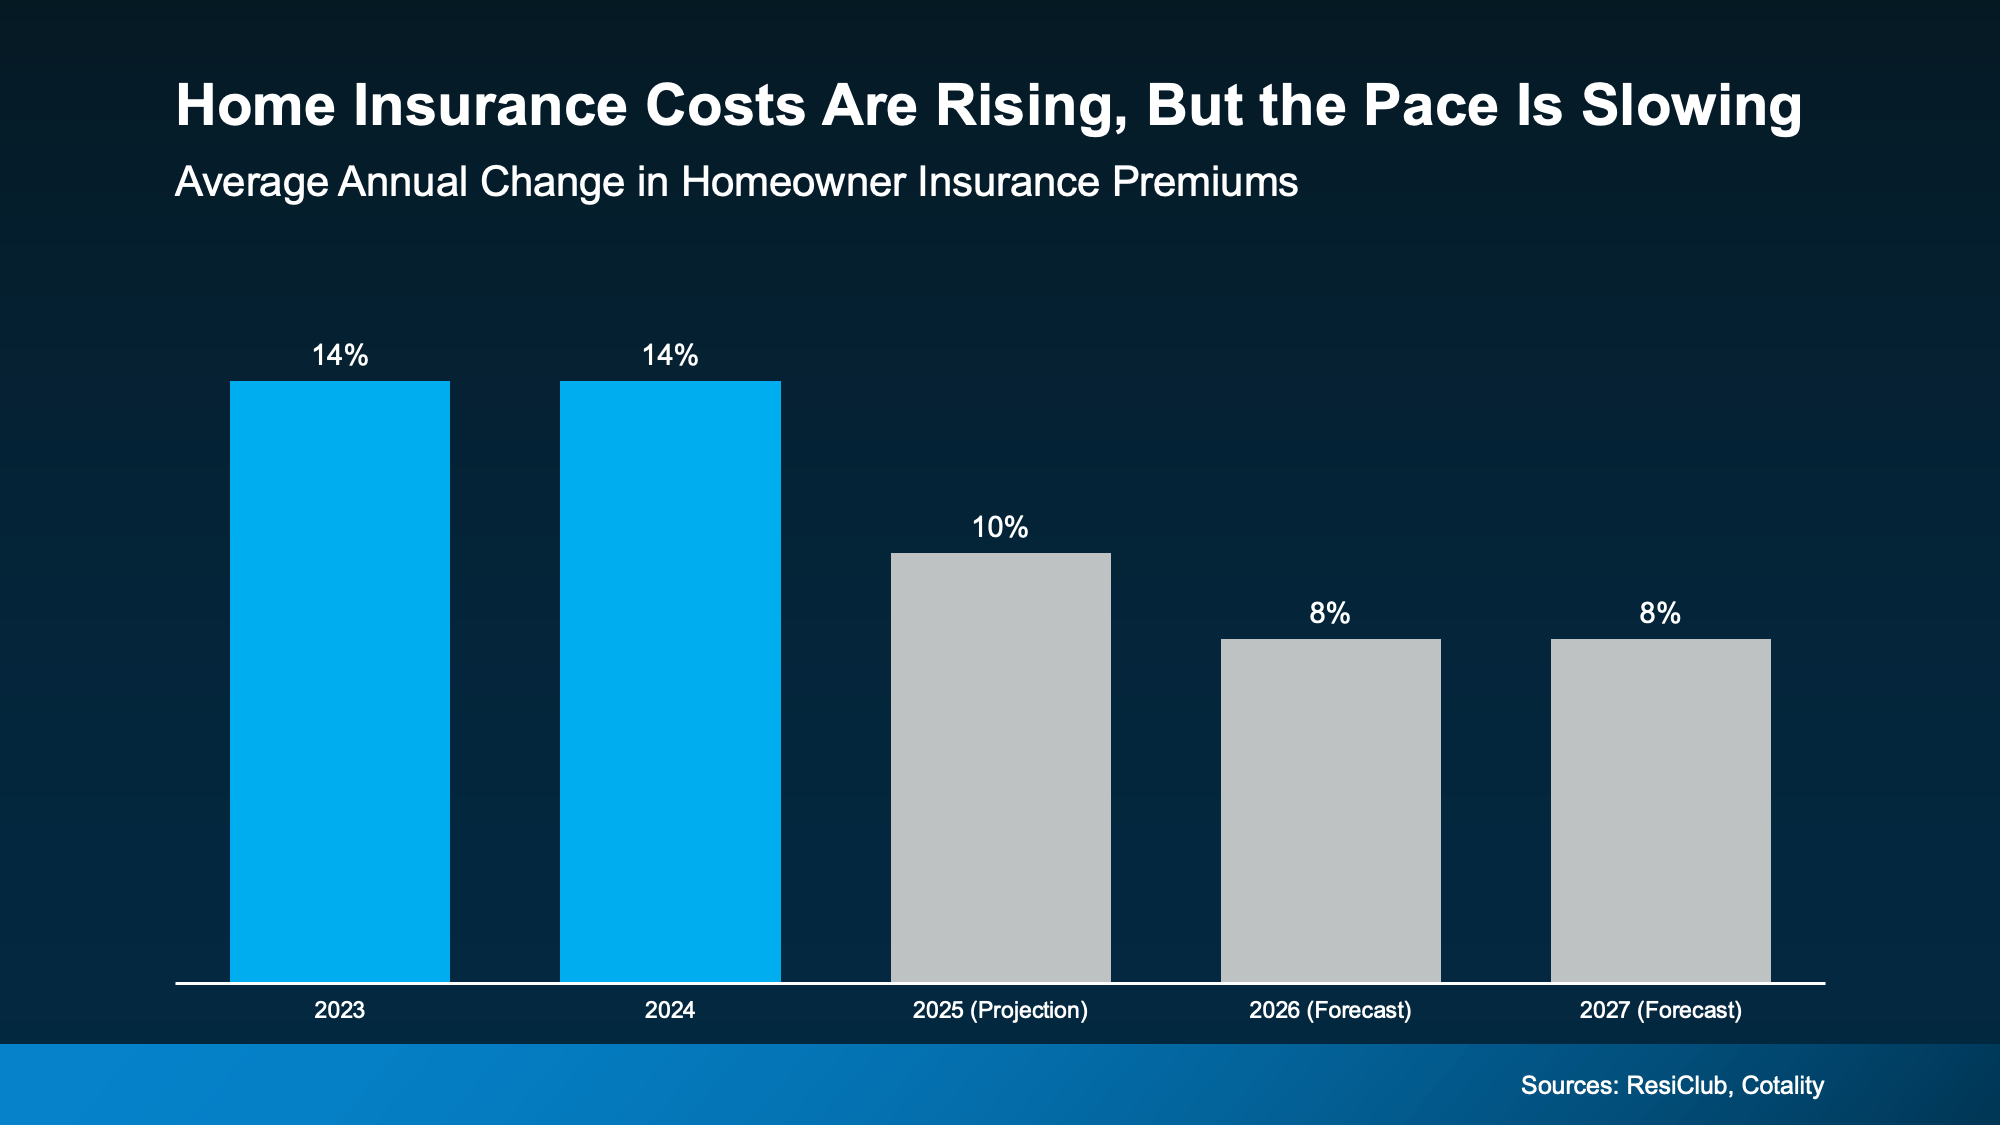 The good news is, the annual pace of the increase may be starting to ease according to ResiClub and Cotality. By their count:
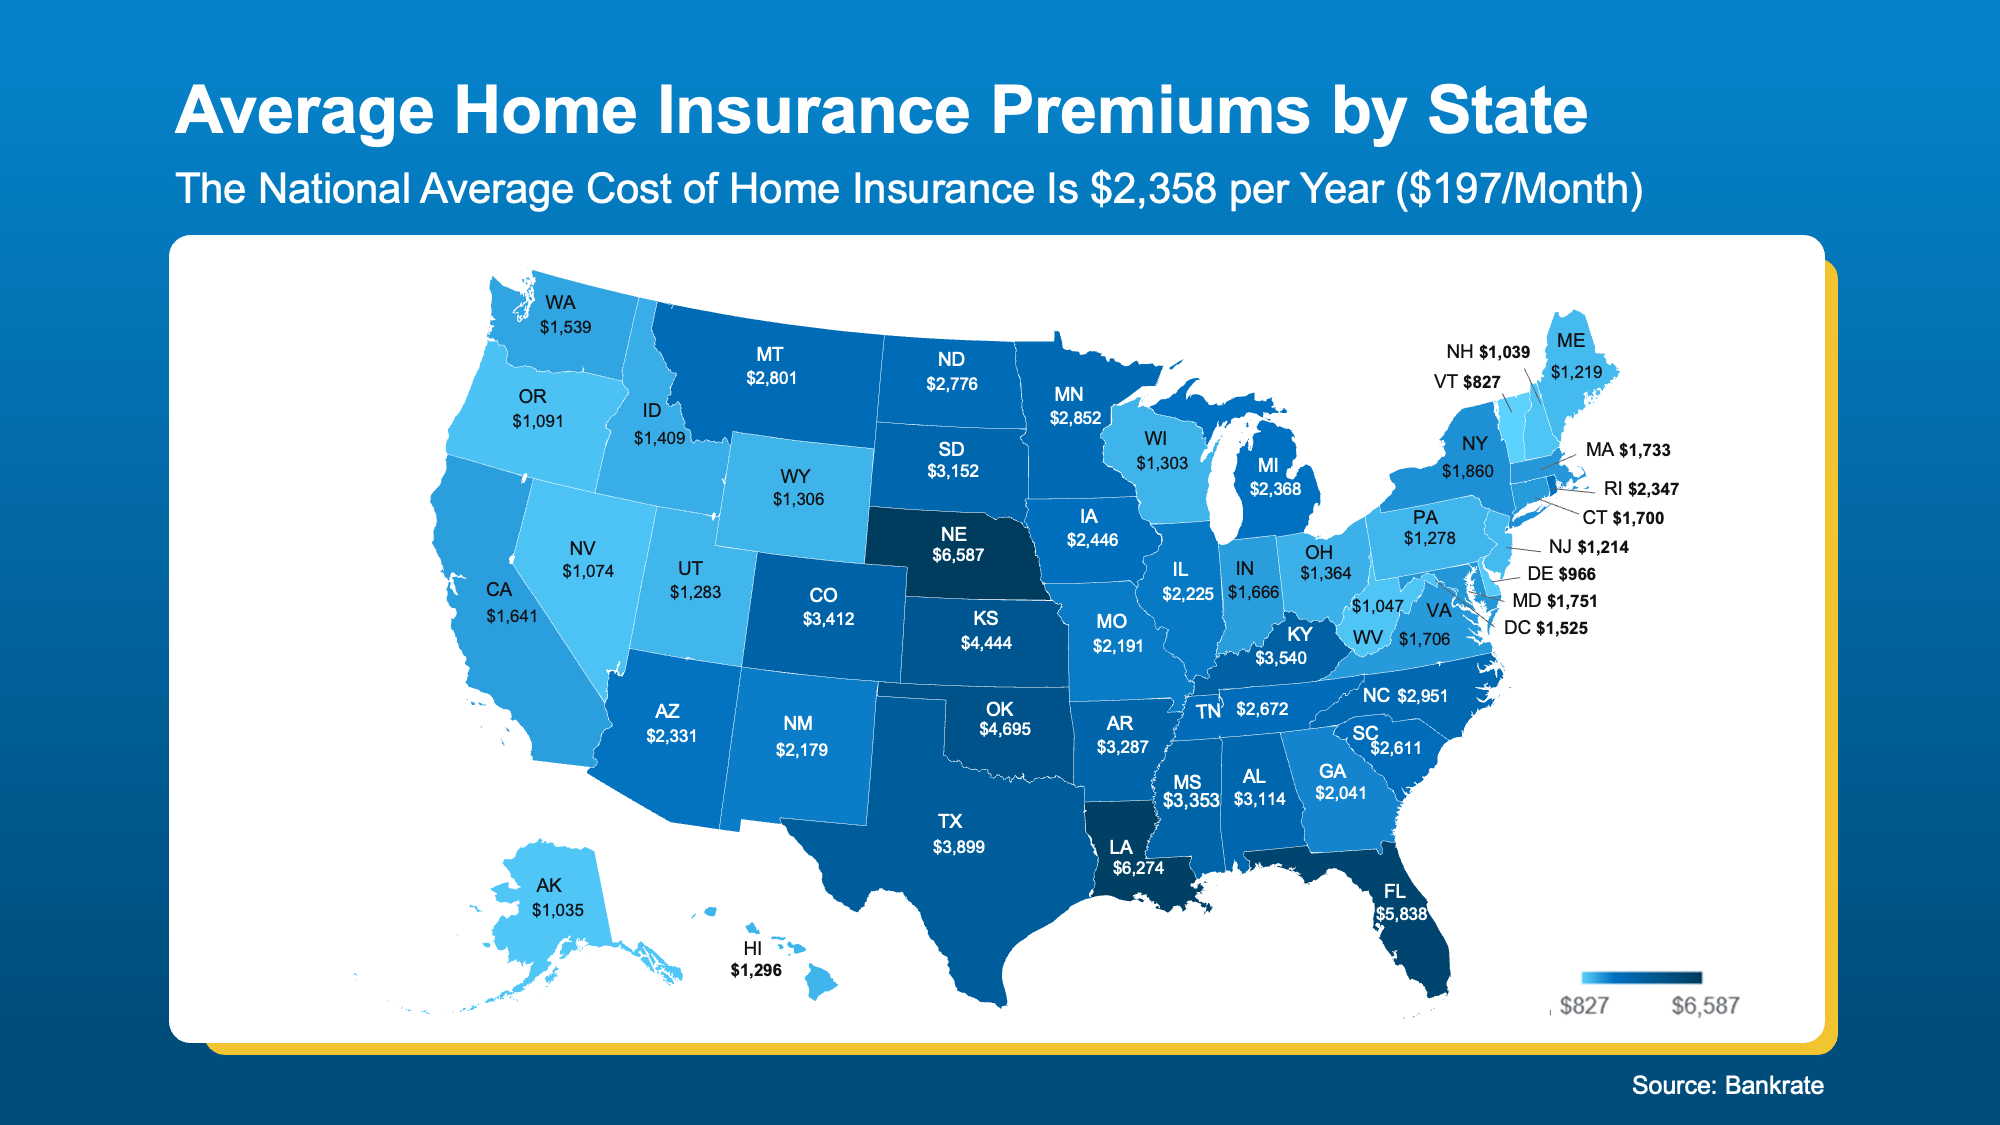 So, What Can You Do About It?

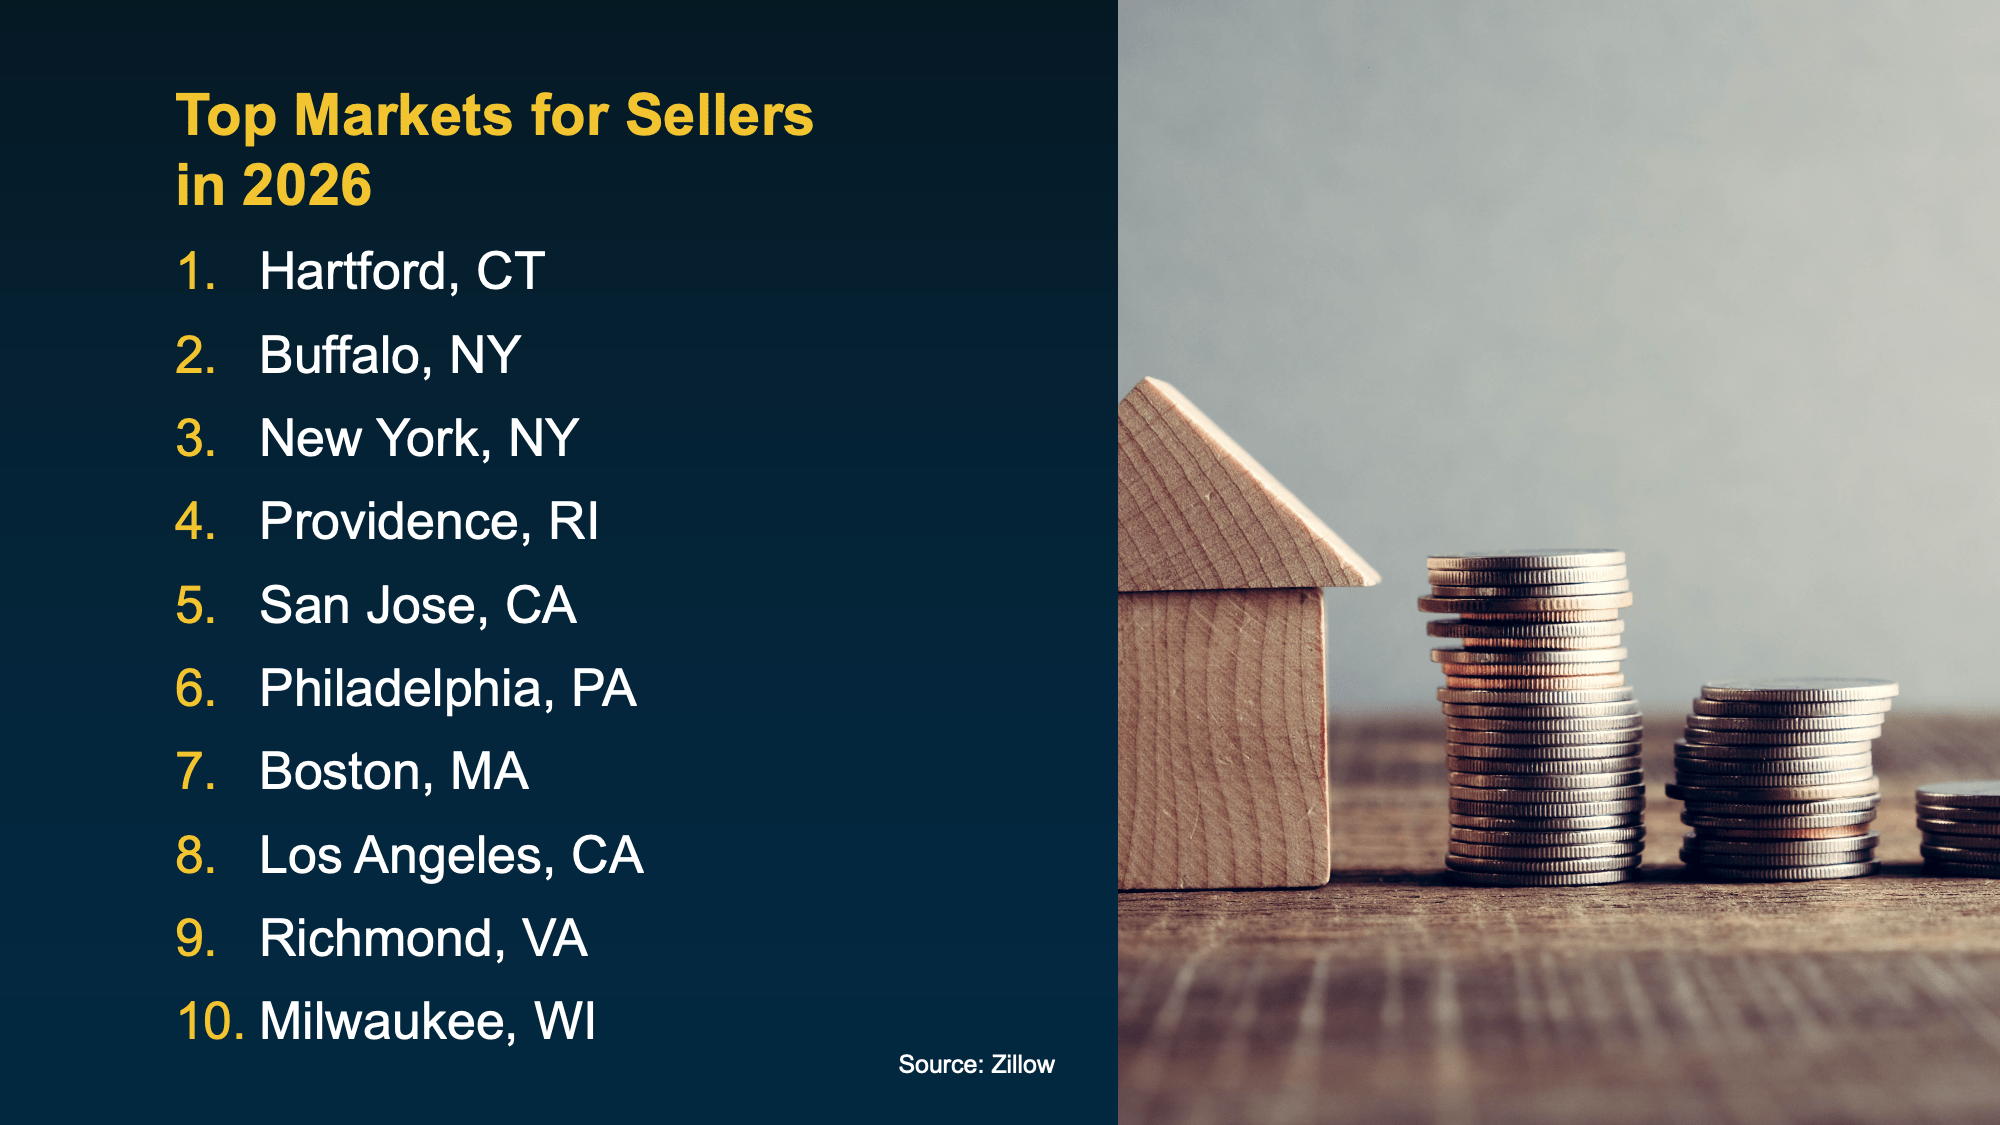 In markets like these, buyers are going to be competing for limited inventory, which gives sellers more leverage.
 These markets stand out for a mix of:
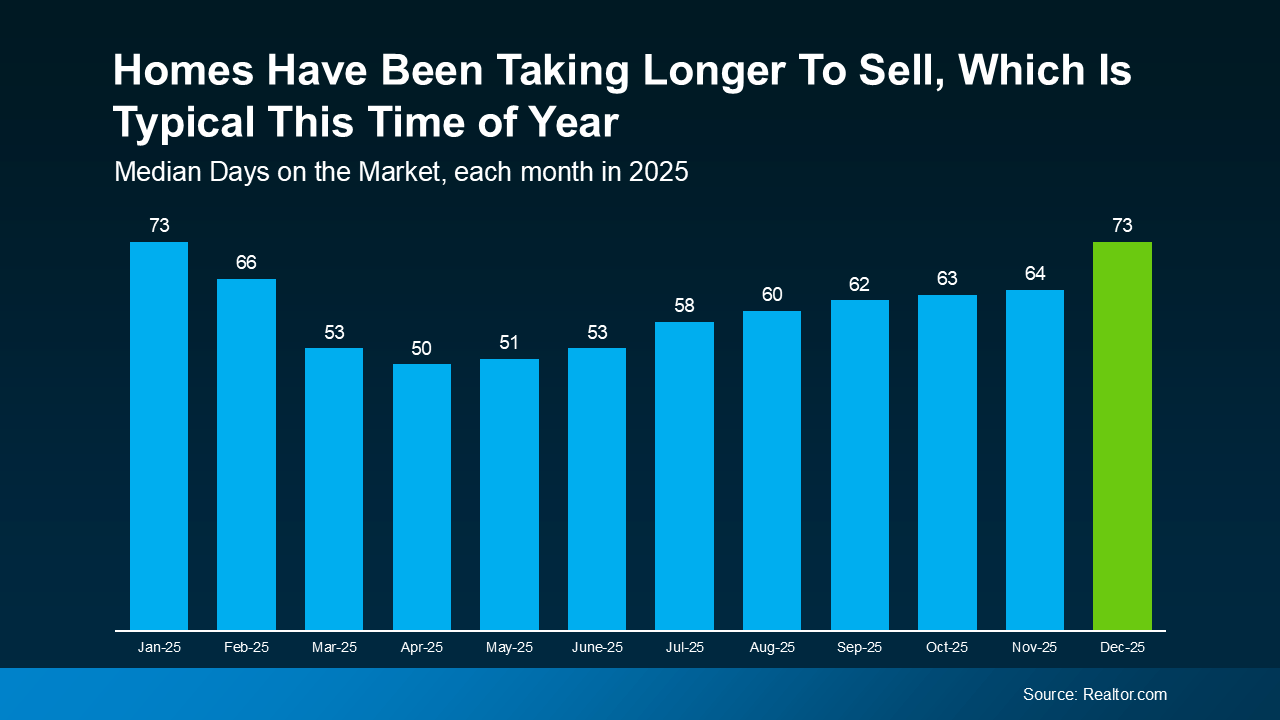 And it’s not that 73 days is slow. That’s actually pretty normal for this time of year. It just feels slow because you heard so much about houses being snapped up in the buying frenzy a few years ago.

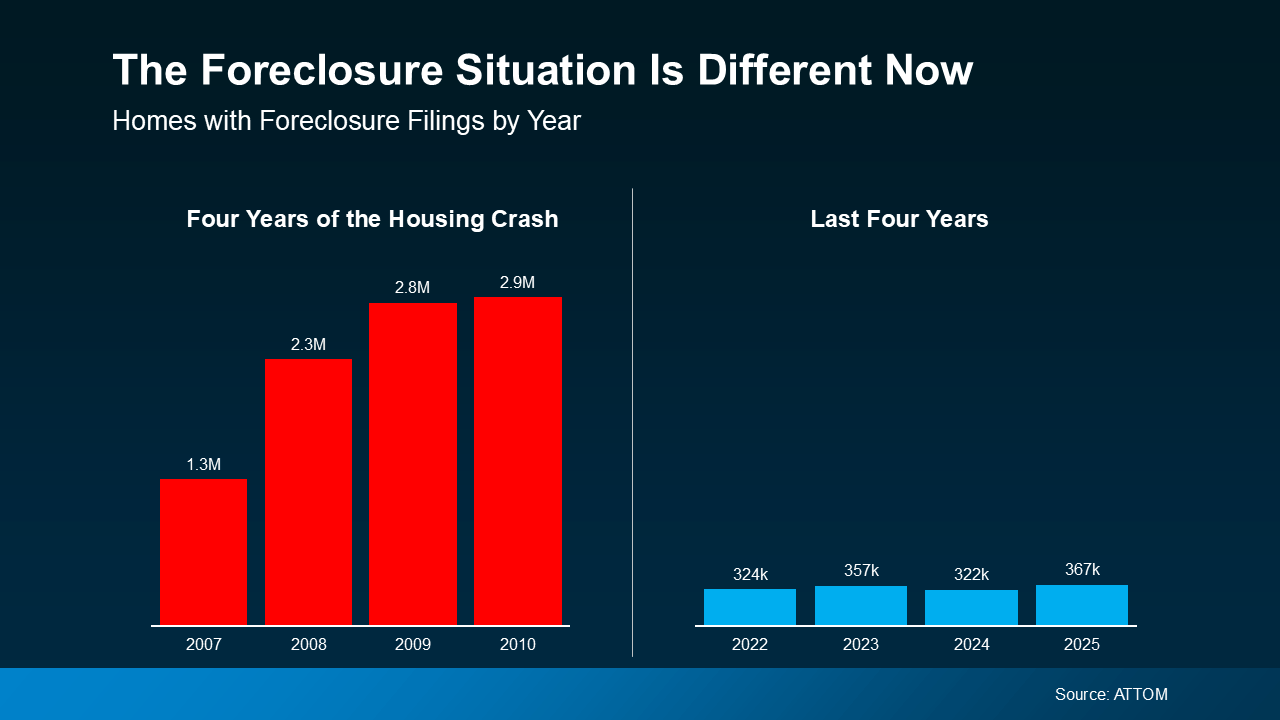 Even with the uptick lately, we are still nowhere near crash levels – far from it. This isn’t a return to crisis levels. What it is, is a return to normal.
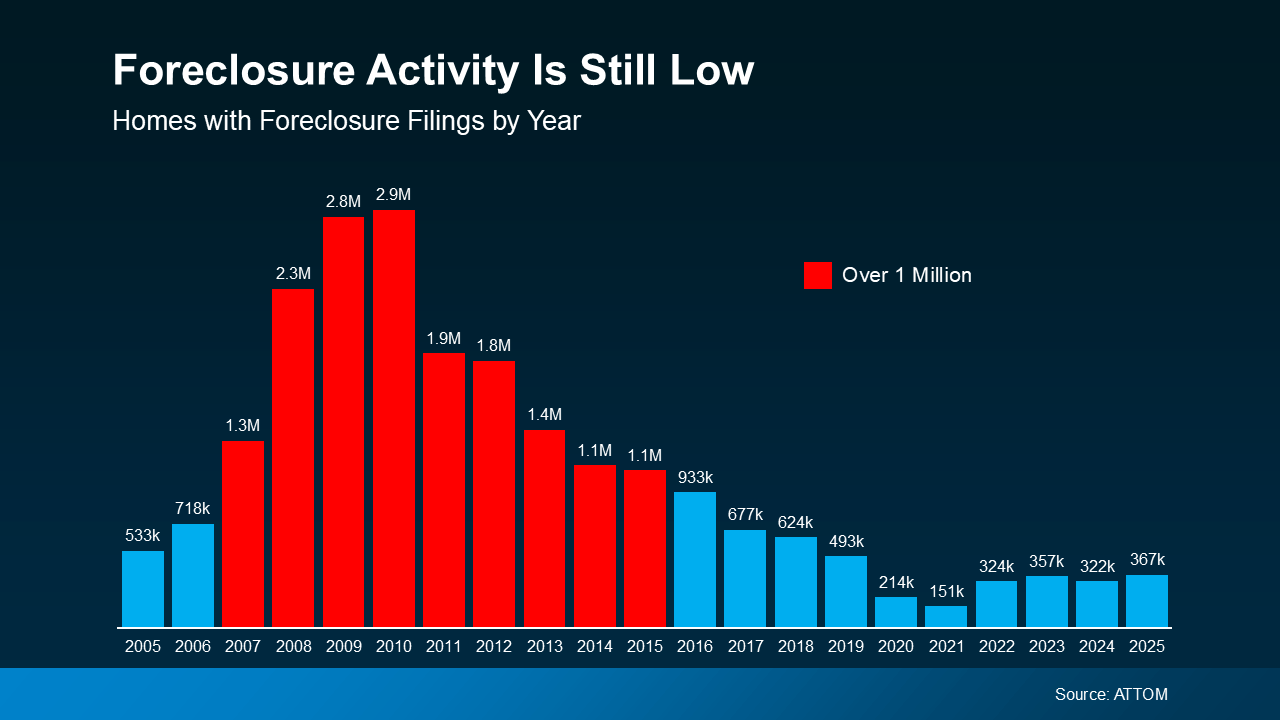 Rob Barber, CEO at ATTOM, explains it well:
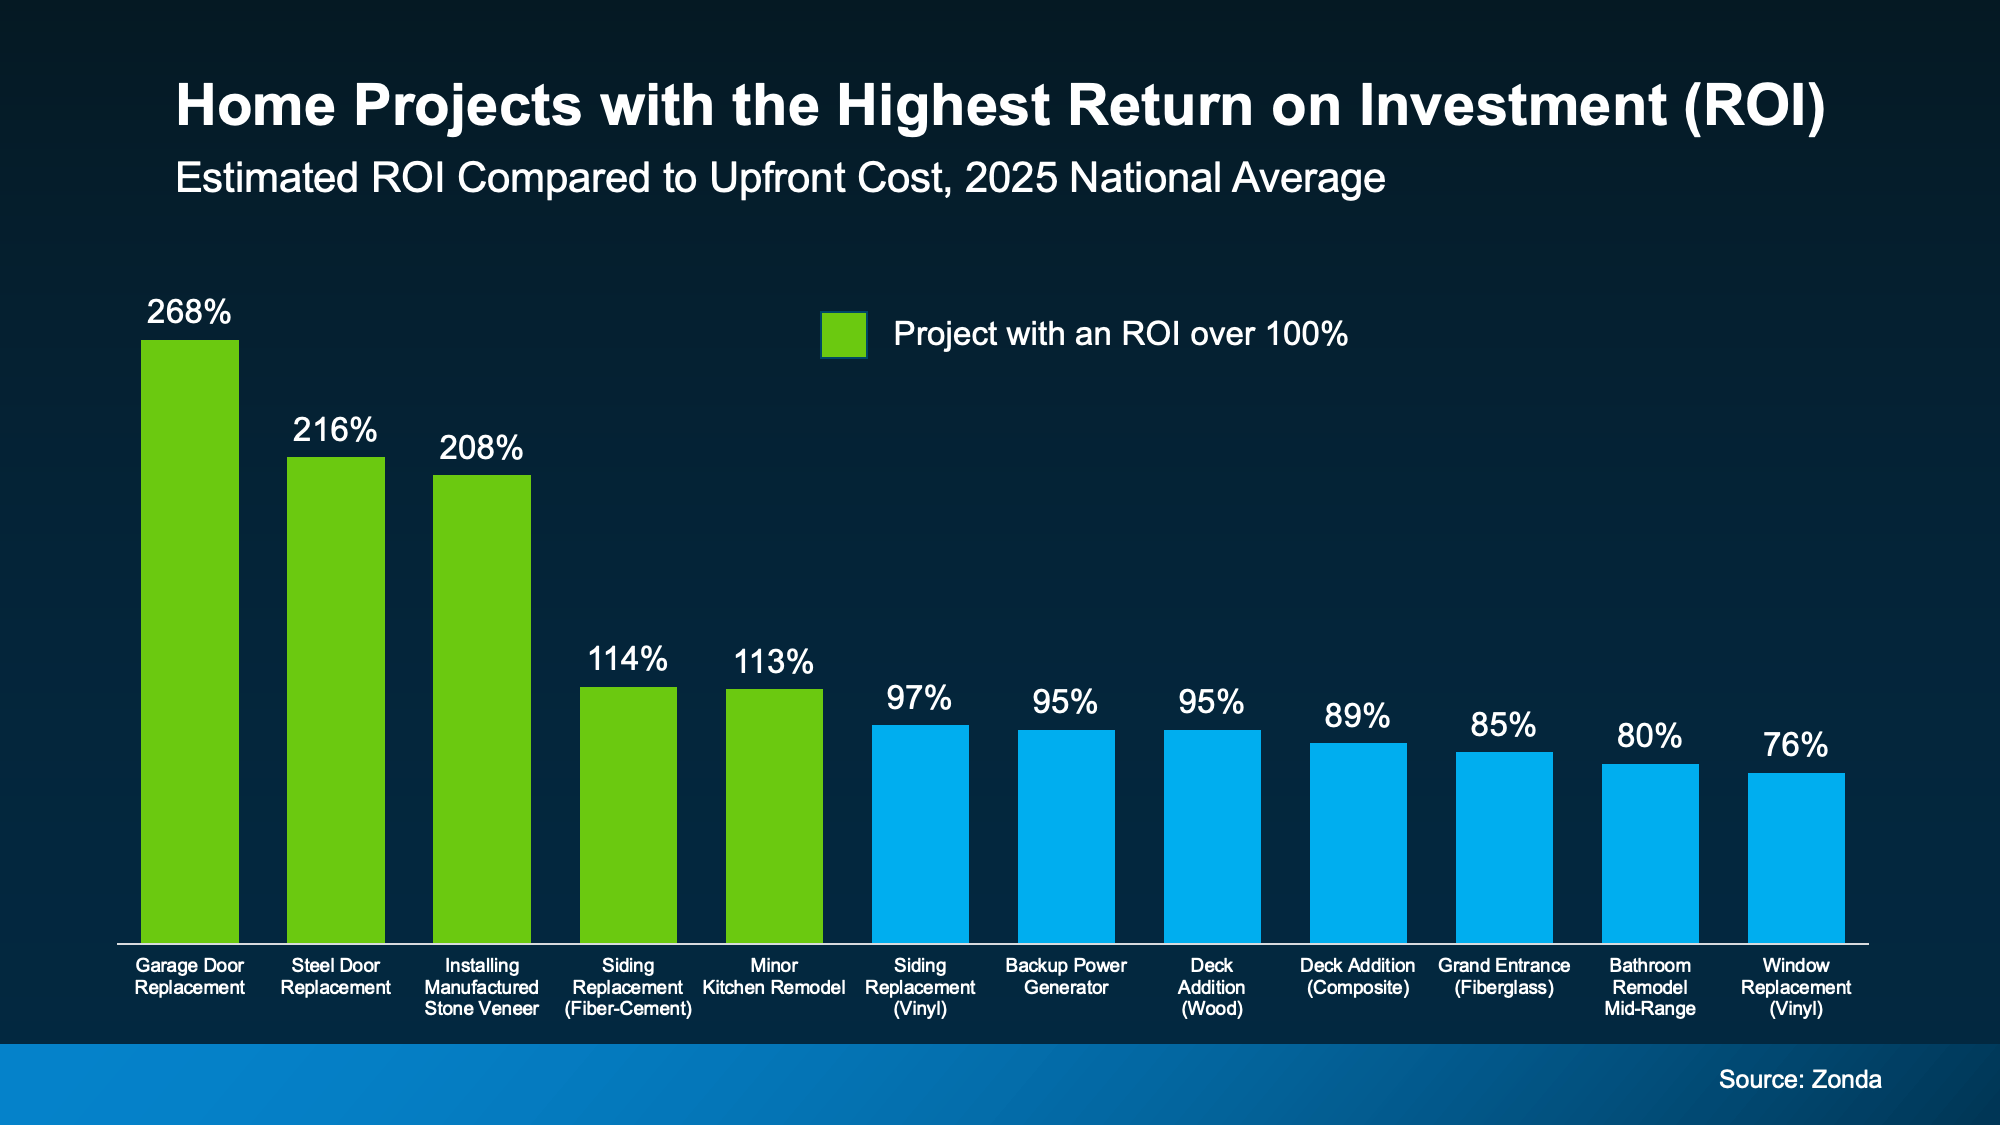 While there's a wide range of projects represented in this data, the cool part is, some of the top winners aren’t big to-do's. They’re just swapping out doors.
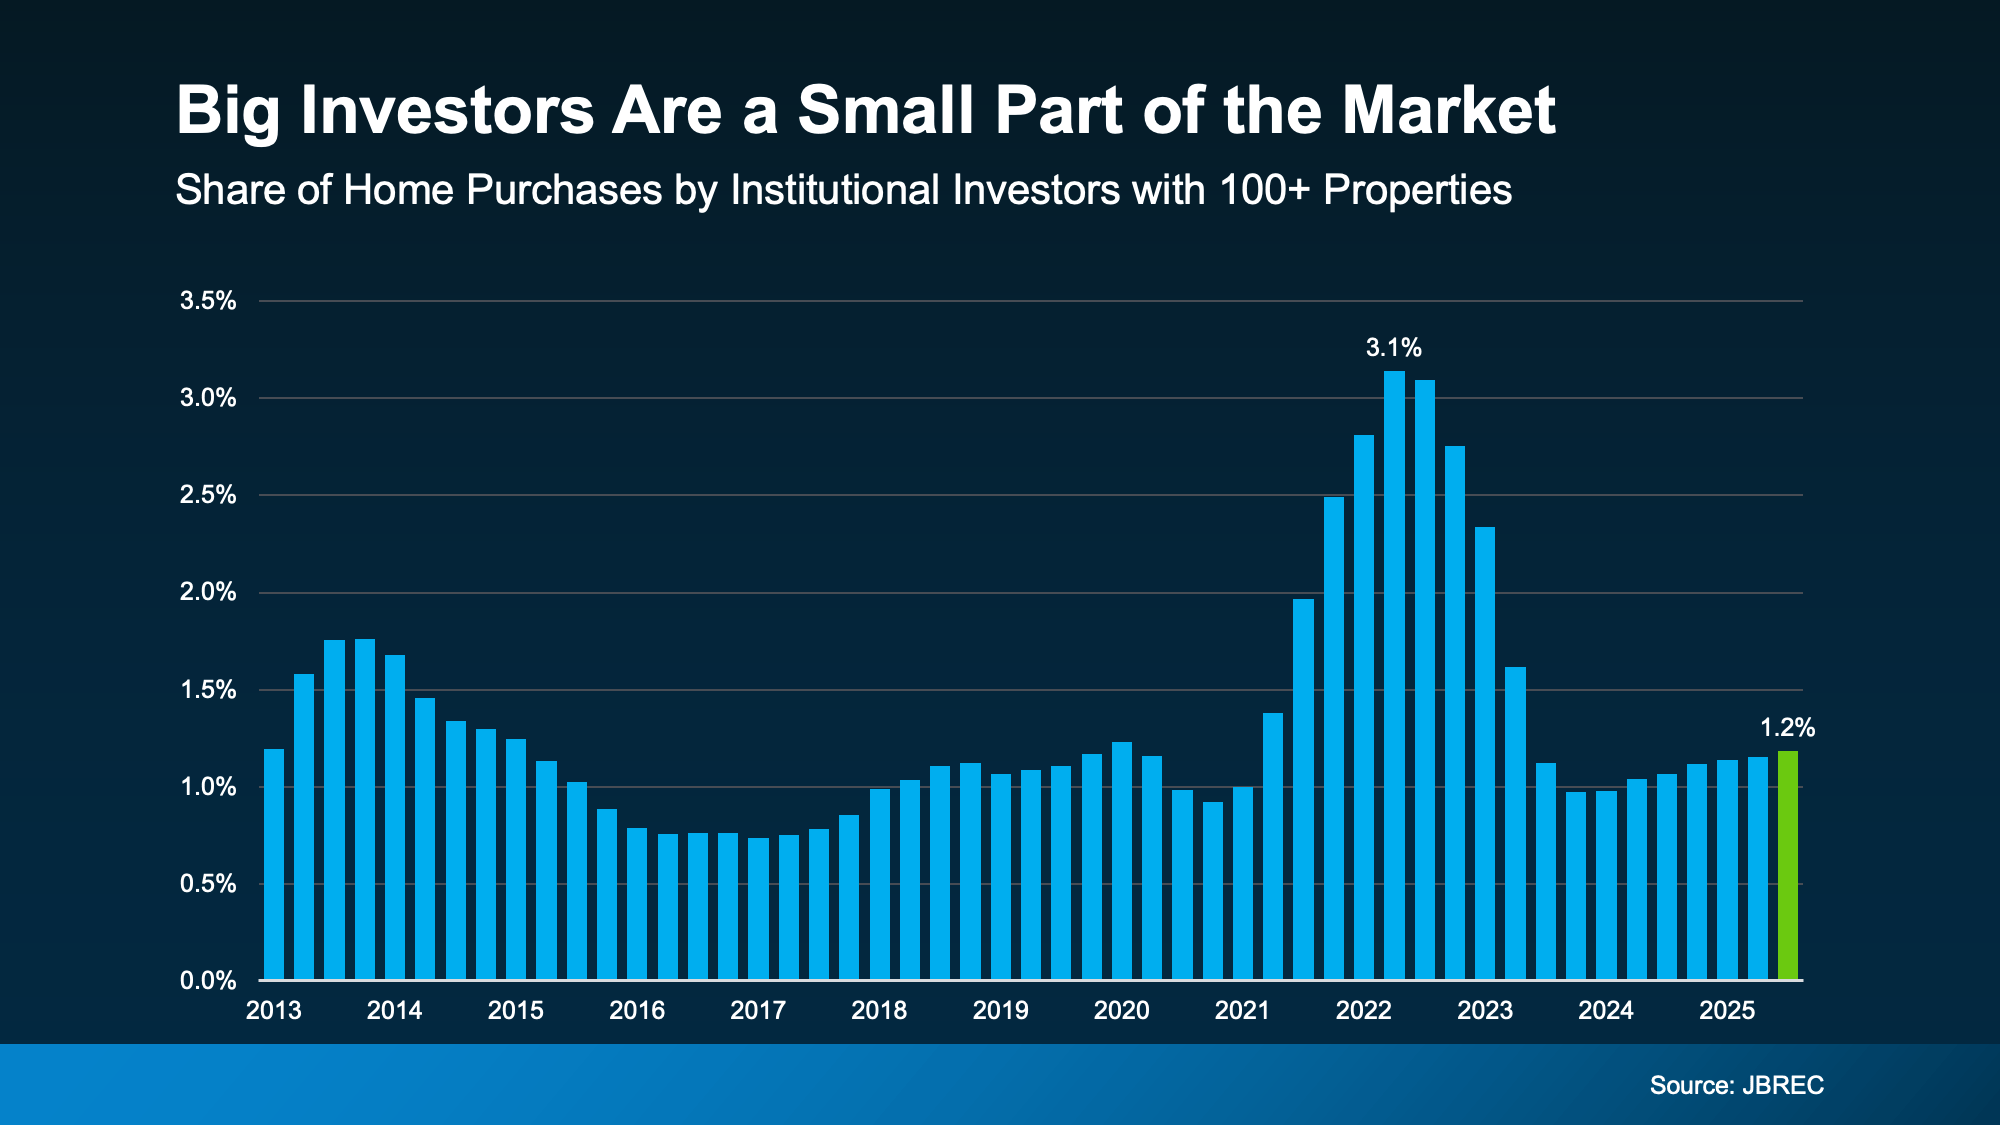 That’s it. Out of every 100 homes sold, only about 1 went to a large institutional investor.